

 v1.0.1
chart_components
Zwei Chart-Komponenten für Flutter. Animierter Balkenchart und animierter Kalender-Gitter-Chart basierend auf dem des GitHub. Viele Eigenschaften zum Anpassen.
49Likes 7930-Tage-Downloads70Pub-Punkte
Keine Plattformdaten
Animiertes Balkendiagramm-Widget für Flutter

Englischer Projektschnappschuss. Aktuelle Inhalte auf GitHub.
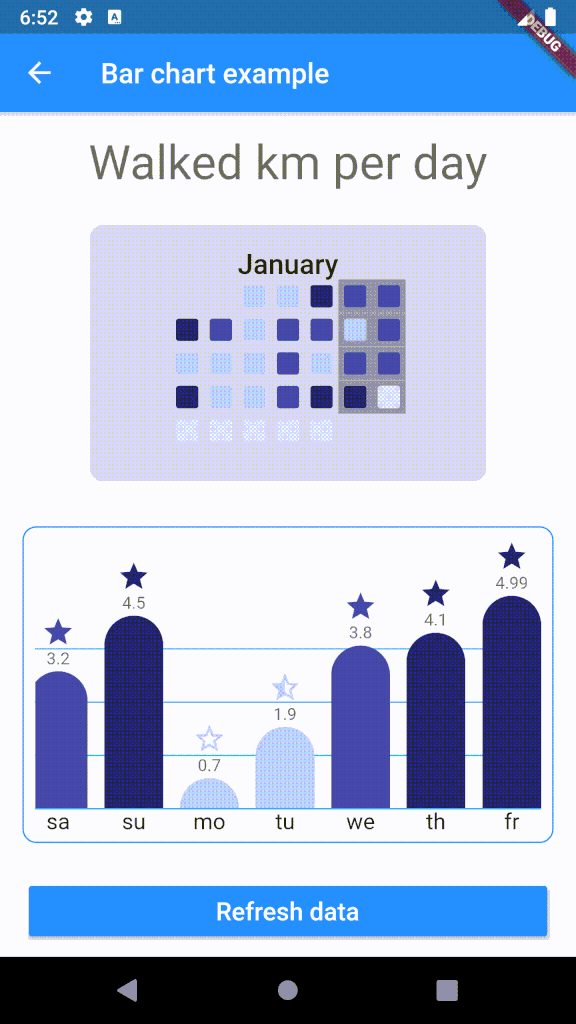
Customizable bar chart for Flutter. The component calculates min and max of data and resizes bars as needed.

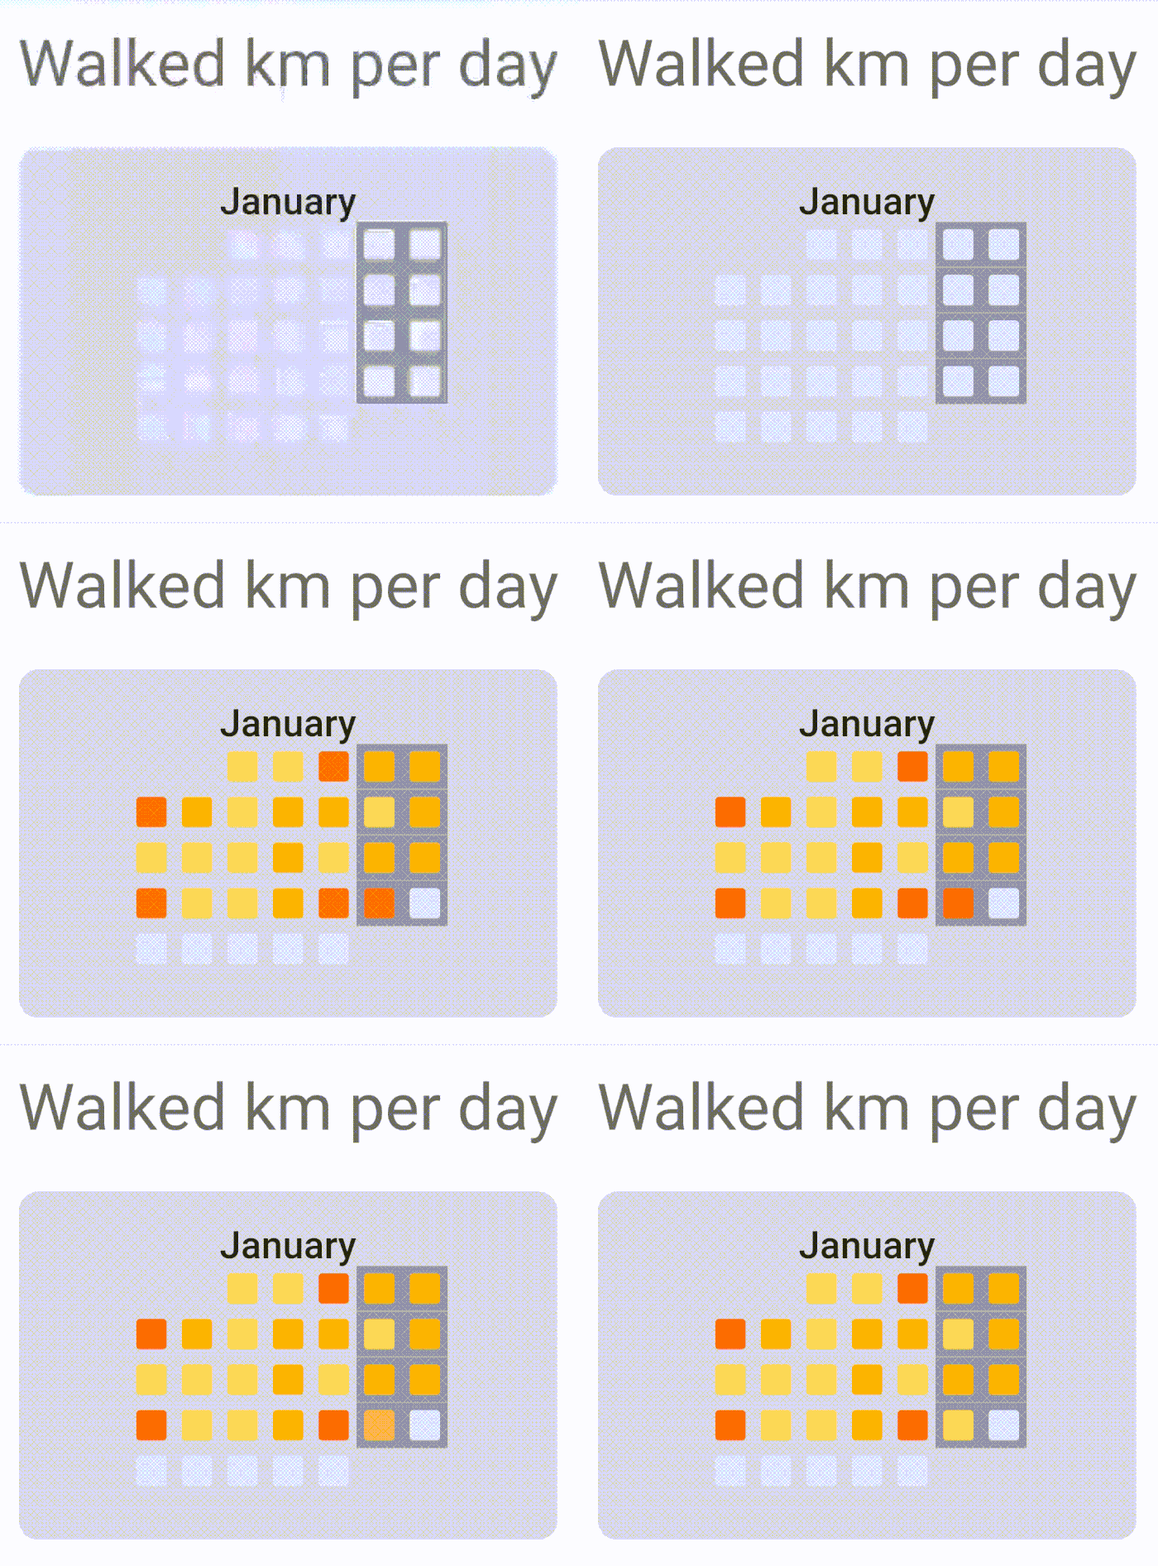

To use plugin, just import package import 'package:chart_components/chart_components.dart';
Check de example directory to access the project that implements the image shown above.
        ........
                    CalendarGrid(
                            year: 2020,
                            month: 1,
                            getColorOfDay: DataRepository.getDayColor,
                            animationDuration: Duration(milliseconds: 1500),
                    ),

        ...........
                    child: BarChart(
                    data: data,
                    labels: labels,
                    dislplayValue: true,
                    reverse: true,
                    getColor: DataRepository.getColor,
                    getIcon: DataRepository.getIcon,
                    barWidth: 42,
                    barSeparation: 12,
                    animationDuration: Duration(milliseconds: 1800),
                    animationCurve: Curves.easeInOutSine,
                    itemRadius: 30,
                    iconHeight: 24,
                    footerHeight: 24,
                    headerValueHeight: 16,
                    roundValuesOnText: false,
                    lineGridColor: Colors.lightBlue,
                    ),
Abhängigkeiten 2 Einträge
{"sdk":"flutter"}{"sdk":"flutter"}Nach Anwendungsfall filtern, Aktivität vergleichen und vor der Nutzung das Originalprojekt prüfen.
“A repository is the most basic element of GitHub.”
GitHub Docs — About repositories ↗