

v0.1.19
modern_charts
一个用于创建简单但现代外观图表的包。
45喜欢 53近 30 天下载30Pub 分数
平台暂无数据
jolleekin/modern_charts open-source repository details.

以下为英文项目原文快照,最新内容请访问 GitHub。
A package for creating simple yet modern looking charts.
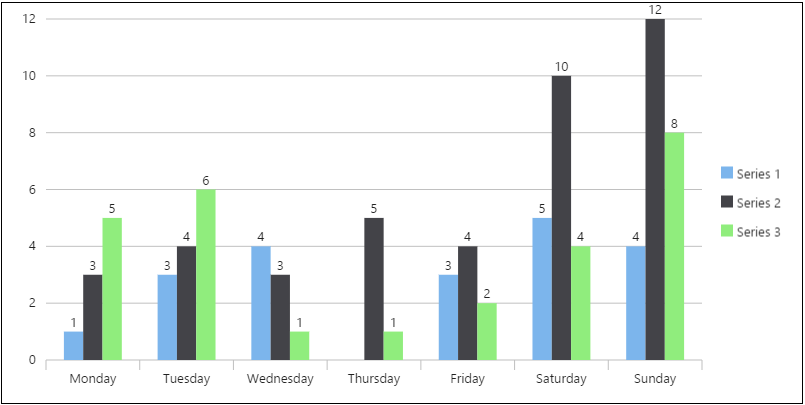
Bar
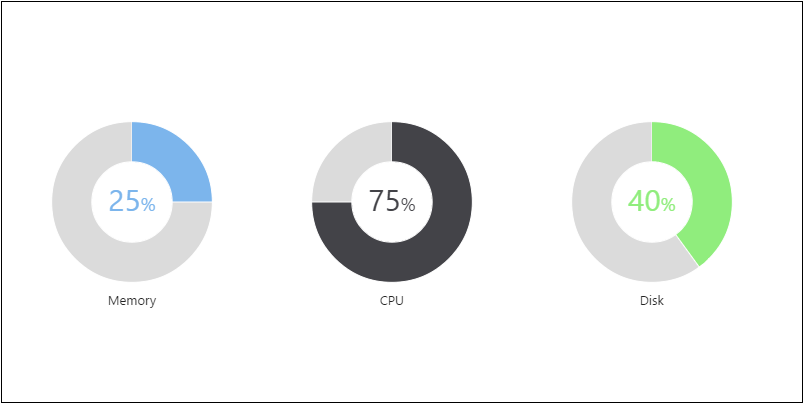
Gauge
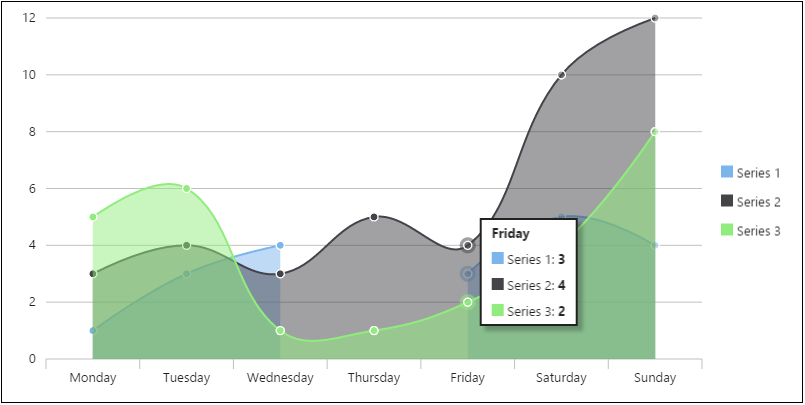
Line
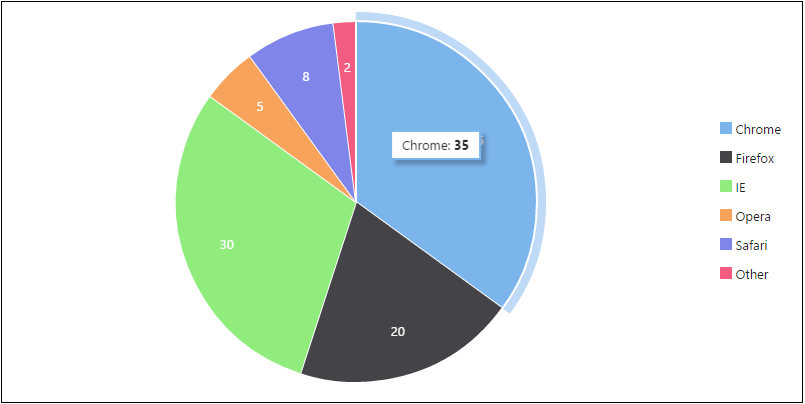
Pie
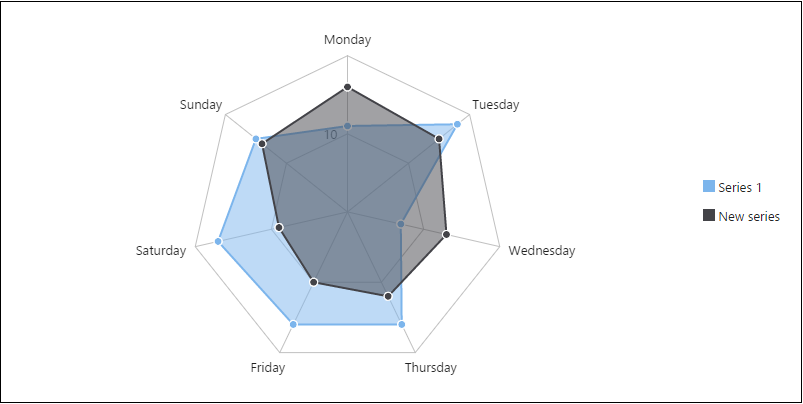
Radar
modern_charts combines Canvas and DOM to achieve the best performance and experience.
Data are passed to a chart via a DataTable object. By using DataTable, you
can flexibly modify the data even after the chart has been rendered.
Animations are supported for different types of data modifications:
Charts automatically resize when the browser is resized.
Each chart type has its own class, so your final production code only contains the code of the chart types you use.
Please read the wiki for instructions on how to use these beautiful charts.
依赖清单 4 项
>=0.15.7anyanyany先按使用场景筛选,再比较项目活跃情况,最后到原始仓库核对使用要求。
“A repository is the most basic element of GitHub.”
GitHub Docs — About repositories ↗