
 v0.0.13
progress_bar_chart
एक पैकेज जो प्रगति सूचकांक और एनीमेशन का उपयोग करके लंबवत चार्ट पर एकाधिक मान दिखाता है।
14लाइक 34530-दिन डाउनलोड145Pub अंक
AndroidiOSWebmacOSWindowsLinux
एक पैकेज जो प्रगति सूचकांक और एनीमेशन का उपयोग करके लंबवत चार्ट पर एकाधिक मान दिखाता है।
यह अंग्रेज़ी मूल स्नैपशॉट है। नवीनतम सामग्री GitHub पर देखें।
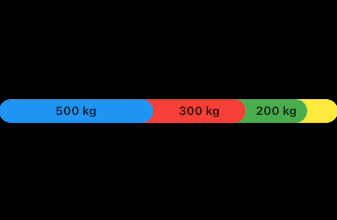
A package to display multipe values on a vertical chart using progess indicators and animation. Each value can has a color .
| Example 1 | Example 2 |
|---|---|
 |
 |
Example 1:
final List<StatisticsItem> stats = [
  StatisticsItem(Colors.blue, 500, title: 'Type 1'),
  StatisticsItem(Colors.green, 200, title: 'Type 2'),
  StatisticsItem(Colors.red, 300, title: 'Type 3'),
  StatisticsItem(Colors.yellow, 100, title: 'Type 4'),
];

ProgressBarChart(
    values: stats,
    height: 30,
    borderRadius: 20,
    totalPercentage: 1100,
    unitLabel: 'kg',
),
Example 2:
final List<StatisticsItem> stats = [
  StatisticsItem(Colors.blue, 0.4),
  StatisticsItem(Colors.green, 0.3),
  StatisticsItem(Colors.red, 0.2),
  StatisticsItem(Colors.yellow, 0.1),
];

ProgressBarChart(
  values: stats,
  height: 30,
  borderRadius: 20,
),
Without labels and colorblend:
final List<StatisticsItem> stats = [
  StatisticsItem(Colors.blue, 0.4),
  StatisticsItem(Colors.green, 0.3),
  StatisticsItem(Colors.red, 0.2),
  StatisticsItem(Colors.yellow, 0.1),
];

ProgressBarChart(
  values: stats,
  height: 30,
  borderRadius: 20,
  showLables: false,
  colorBlend: false,
)

निर्भरता सूची 5 आइटम
{"sdk":"flutter"}^0.20.2^4.5.0{"sdk":"flutter"}^4.0.0उपयोग के अनुसार छाँटें, गतिविधि की तुलना करें और अपनाने से पहले मूल प्रोजेक्ट की आवश्यकताएँ जाँचें।
“A repository is the most basic element of GitHub.”
GitHub Docs — About repositories ↗