

v0.1.19
modern_charts
간단하면서도 현대적인 외관의 차트를 만들 수 있는 패키지입니다.
45좋아요 5330일 다운로드30Pub 점수
플랫폼 정보 없음
jolleekin/modern_charts open-source repository details.

아래는 영문 원문 스냅샷입니다. 최신 내용은 GitHub에서 확인하세요.
A package for creating simple yet modern looking charts.
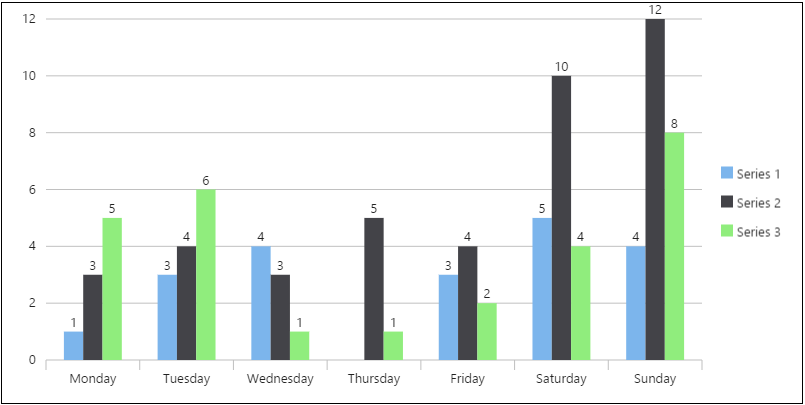
Bar
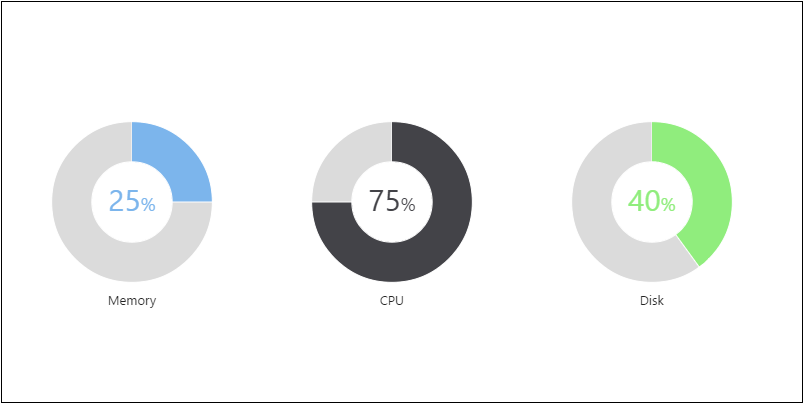
Gauge
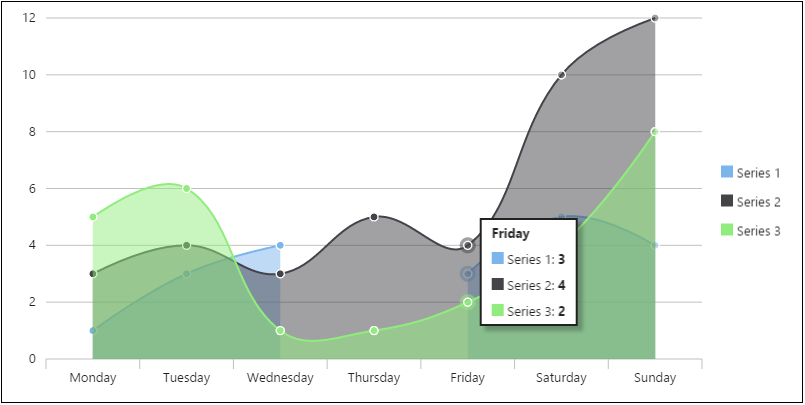
Line
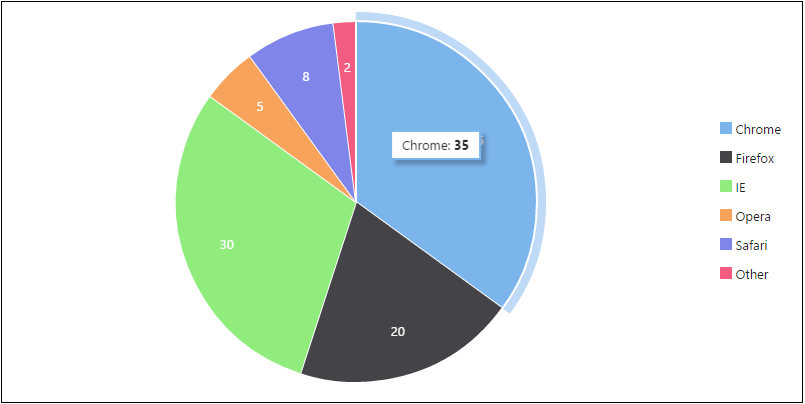
Pie
Radar
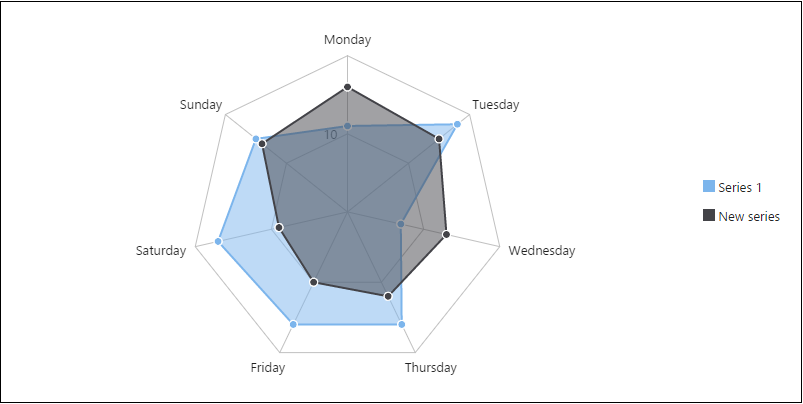
modern_charts combines Canvas and DOM to achieve the best performance and experience.
Data are passed to a chart via a DataTable object. By using DataTable, you
can flexibly modify the data even after the chart has been rendered.
Animations are supported for different types of data modifications:
Charts automatically resize when the browser is resized.
Each chart type has its own class, so your final production code only contains the code of the chart types you use.
Please read the wiki for instructions on how to use these beautiful charts.
의존성 목록 4 개
>=0.15.7anyanyany사용 목적에 따라 검색하고 개발 활동을 비교한 뒤 원본 저장소에서 요구 사항을 확인하세요.
“A repository is the most basic element of GitHub.”
GitHub Docs — About repositories ↗