

 v2.1.0
flutter_graph_view
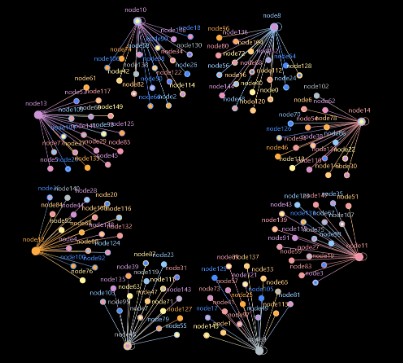
Widgets para estruturas de dados gráficas bonitas, como diagramas orientados por força.
93Curtidas 3,1 milDownloads em 30 dias160Pontos Pub
AndroidiOSWebmacOSWindowsLinux
Um projeto de código aberto que pode exibir belas estruturas de dados gráficas, como forçadas direcionadas.

Texto original em inglês. Visite o GitHub para a versão atual.


Widgets for beautiful graphic data structures, such as force-oriented diagrams.
https://github.com/graph-cn/flutter_graph_view/assets/15630211/a035cd7d-bdac-4ef6-8abf-74594e9d699b
[x] Data converter: convert business data into graphic view data.
[x] Algorithm: calculate vertex layout.
[x] Data panel embedding.
[x] Style configuration.
[ ] More graphical interactions.
flutter pub add flutter_graph_view
// Copyright (c) 2023- All flutter_graph_view authors. All rights reserved.
//
// This source code is licensed under Apache 2.0 License.

import 'dart:math';

import 'package:flutter/material.dart';
import 'package:flutter_graph_view/flutter_graph_view.dart';

class DecoratorDemo extends StatelessWidget {
  const DecoratorDemo({super.key});

  @override
  Widget build(BuildContext context) {
    var vertexes = <Map>{};
    var r = Random();
    for (var i = 0; i < 150; i++) {
      vertexes.add(
        {
          'id': 'node$i',
          'tag': 'tag${r.nextInt(9)}',
          'tags': [
            'tag${r.nextInt(9)}',
            if (r.nextBool()) 'tag${r.nextInt(4)}',
            if (r.nextBool()) 'tag${r.nextInt(8)}'
          ],
        },
      );
    }
    var edges = <Map>{};

    for (var i = 0; i < 150; i++) {
      edges.add({
        'srcId': 'node${i % 8 + 8}',
        'dstId': 'node$i',
        'edgeName': 'edge${r.nextInt(3)}',
        'ranking': DateTime.now().millisecond,
      });
    }
    // for (var i = 0; i < 20; i++) {
    //   edges.add({
    //     'srcId': 'node${i % 8}',
    //     'dstId': 'node${r.nextInt(150)}',
    //     'edgeName': 'edge${r.nextInt(3)}',
    //     'ranking': DateTime.now().millisecond,
    //   });
    // }

    var data = {
      'vertexes': vertexes,
      'edges': edges,
    };
    return FlutterGraphWidget(
      data: data,
      algorithm: RandomAlgorithm(
        decorators: [
          CoulombDecorator(),
          // HookeBorderDecorator(),
          HookeDecorator(),
          CoulombCenterDecorator(),
          HookeCenterDecorator(),
          ForceDecorator(),
          ForceMotionDecorator(),
          TimeCounterDecorator(),
        ],
      ),
      convertor: MapConvertor(),
      options: Options()
        ..enableHit = false
        ..panelDelay = const Duration(milliseconds: 500)
        ..graphStyle = (GraphStyle()
          // tagColor is prior to tagColorByIndex. use vertex.tags to get color
          ..tagColor = {'tag8': Colors.orangeAccent.shade200}
          ..tagColorByIndex = [
            Colors.red.shade200,
            Colors.orange.shade200,
            Colors.yellow.shade200,
            Colors.green.shade200,
            Colors.blue.shade200,
            Colors.blueAccent.shade200,
            Colors.purple.shade200,
            Colors.pink.shade200,
            Colors.blueGrey.shade200,
            Colors.deepOrange.shade200,
          ])
        ..useLegend = true // default true
        ..edgePanelBuilder = edgePanelBuilder
        ..vertexPanelBuilder = vertexPanelBuilder
        ..edgeShape = EdgeLineShape() // default is EdgeLineShape.
        ..vertexShape = VertexCircleShape(), // default is VertexCircleShape.
    );
  }

  Widget edgePanelBuilder(Edge edge, Viewfinder viewfinder) {
    var c = viewfinder.localToGlobal(edge.position);

    return Stack(
      children: [
        Positioned(
          left: c.x + 5,
          top: c.y,
          child: SizedBox(
            width: 200,
            child: ColoredBox(
              color: Colors.grey.shade900.withAlpha(200),
              child: ListTile(
                title: Text(
                    '${edge.edgeName} @${edge.ranking}\nDelay controlled by \noptions.panelDelay\ndefault to 300ms'),
              ),
            ),
          ),
        )
      ],
    );
  }

  Widget vertexPanelBuilder(hoverVertex, Viewfinder viewfinder) {
    var c = viewfinder.localToGlobal(hoverVertex.cpn!.position);
    return Stack(
      children: [
        Positioned(
          left: c.x + hoverVertex.radius + 5,
          top: c.y - 20,
          child: SizedBox(
            width: 120,
            child: ColoredBox(
              color: Colors.grey.shade900.withAlpha(200),
              child: ListTile(
                title: Text(
                  'Id: ${hoverVertex.id}',
                ),
                subtitle: Text(
                    'Tag: ${hoverVertex.data['tag']}\nDegree: ${hoverVertex.degree} ${hoverVertex.prevVertex?.id}'),
              ),
            ),
          ),
        )
      ],
    );
  }
}
flutter_graph_view is under the Apache License, Version 2.0.
Lista de dependências 7 itens
^2.2.0^6.1.2^0.20.2{"sdk":"flutter"}{"sdk":"flutter"}^6.0.0^6.0.0Filtre pelo caso de uso, compare a atividade e confira o projeto original antes de adotá-lo.
“A repository is the most basic element of GitHub.”
GitHub Docs — About repositories ↗