graphify_banner
Pub Package
GitHub Repo stars
GitHub closed issues
GitHub open issues
GitHub contributors
Contributing
GRAPHIFY
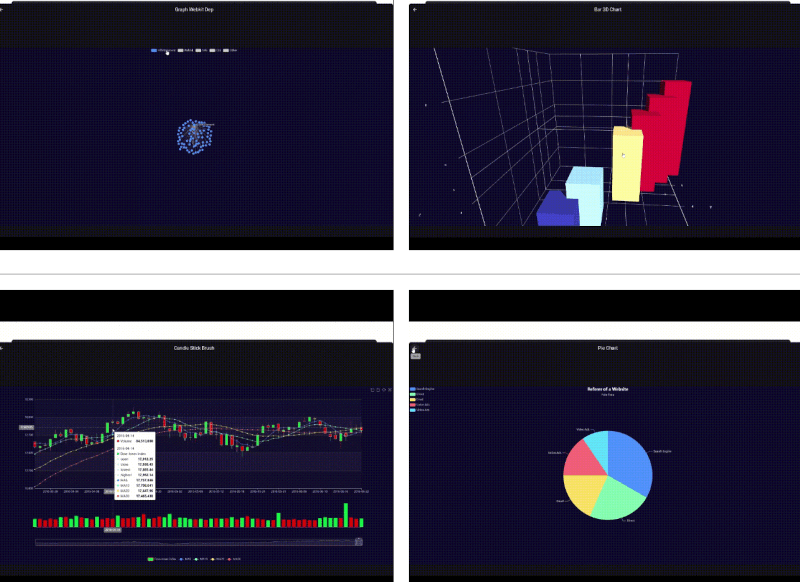
A data visualization charts library, based on Apache Echarts, able to build advanced charts like WebGL 3D, Bar, Line, Candlestick, Radar, Graph, Tree etc.
A Flutter package that serves as a bridge to Apache ECharts for creating interactive charts and data visualizations in your Flutter applications.
| graph_webkit_dep |
bar_3d_chart |
| candle_stick_brush |
all |
See demo
Echarts Examples
Pub.dev
Content
Features
Installation
Quick Start
Basic Example
Parameters and Settings
License
Contributing
Features
- Apache ECharts Integration: Leverage the full power of Apache ECharts directly within your Flutter app.
- Flexible Configuration: Pass chart configurations as JSON to render interactive visualizations.
- All ECharts Features: You can find here eCharts features
Installation
How quickly you can install the package you can find here.
Quick Start
Importing the Package
Import the package into your Dart file:
import 'package:graphify/graphify.dart';
Basic Example
Below is a minimal example demonstrating how to display a bar chart:
class BasicBarChart extends StatefulWidget {
  const BasicBarChart({super.key});

  @override
  State<BasicBarChart> createState() => _BasicBarChartState();
}

class _BasicBarChartState extends State<BasicBarChart> {

  final controller = GraphifyController();

  @override
  Widget build(BuildContext context) {
    return GraphifyView(
      controller: controller,
      initialOptions: const {
        "xAxis": {
          "type": "category",
          "data": ["Mon", "Tue", "Wed", "Thu", "Fri", "Sat", "Sun"]
        },
        "yAxis": {
          "type": "value"
        },
        "series": [
          {
            "data": [120, 200, 150, 80, 70, 110, 130],
            "type": "bar"
          }
        ]
      },
    );
  }

  @override
  void dispose() {
    controller.dispose();
    super.dispose();
  }

}
Parameters and Settings
A string containing the JSON configuration for the chart, based on the Apache ECharts documentation.
Documentation and Support
Refer to the Apache ECharts Documentation for detailed configuration options and features.
For source code, issue tracking, and contributions, visit the GitHub repository.
License
This project is licensed under the MIT License.
Contributing
We welcome your contributions!
- Fork the repository and create a branch for your changes.
- Commit your changes with clear messages.
- Open a pull request describing your work.
For bug reports or feature requests, please open an issue.
Thank you!


 v1.2.1