

 v2.5.0
flutter_echarts
一個基於 Apache ECharts 的資料視覺化圖表庫,能夠建立進階圖表,例如 WebGL 3D、GIS 地圖等。
578喜歡 5130近 30 天下載130Pub 分數
AndroidiOSmacOS
一個用於以反應式方式使用 Apache ECharts 的 Flutter 小部件。

以下為英文專案原文快照,最新內容請造訪 GitHub。
After many years, this project, as a transitional solution using Webview, has completed its historical mission and is therefore being archived. We recommend Graphic or other native chart libraries as alternatives.


Reactive Updating
The most exciting feature of Flutter widgets and React components is that the view can update reactively when data changes. Thanks to ECharts' data driven architecture, flutter_echarts implements a reactive way to connect charts with data. The charts automatically re-render when data in the option property changes.
Two Way Communication
The onMessage and extraScript properties provide a way to set two-way event communication between Flutter and JavaScript.
Configurable Extensions
ECharts has a lot of extensions. The extensions property allows you to inject the extension scripts as raw strings. In this way, you can copy these scripts to your source code without being confusing by assets dirs.
Add this to your package's pubspec.yaml file:
dependencies:
  flutter_echarts: #latest version
Now in your Dart code, you can use:
import 'package:flutter_echarts/flutter_echarts.dart';
Details see pub.dev.
The flutter_echarts package itself is very simple to use, just like a common statelessWidget:
Details about the
optionobject is in the Echarts docs or Echarts examples.
Container(
  child: Echarts(
  option: '''
    {
      xAxis: {
        type: 'category',
        data: ['Mon', 'Tue', 'Wed', 'Thu', 'Fri', 'Sat', 'Sun']
      },
      yAxis: {
        type: 'value'
      },
      series: [{
        data: [820, 932, 901, 934, 1290, 1330, 1320],
        type: 'line'
      }]
    }
  ''',
  ),
  width: 300,
  height: 250,
)
See the full flutter_echarts_example.
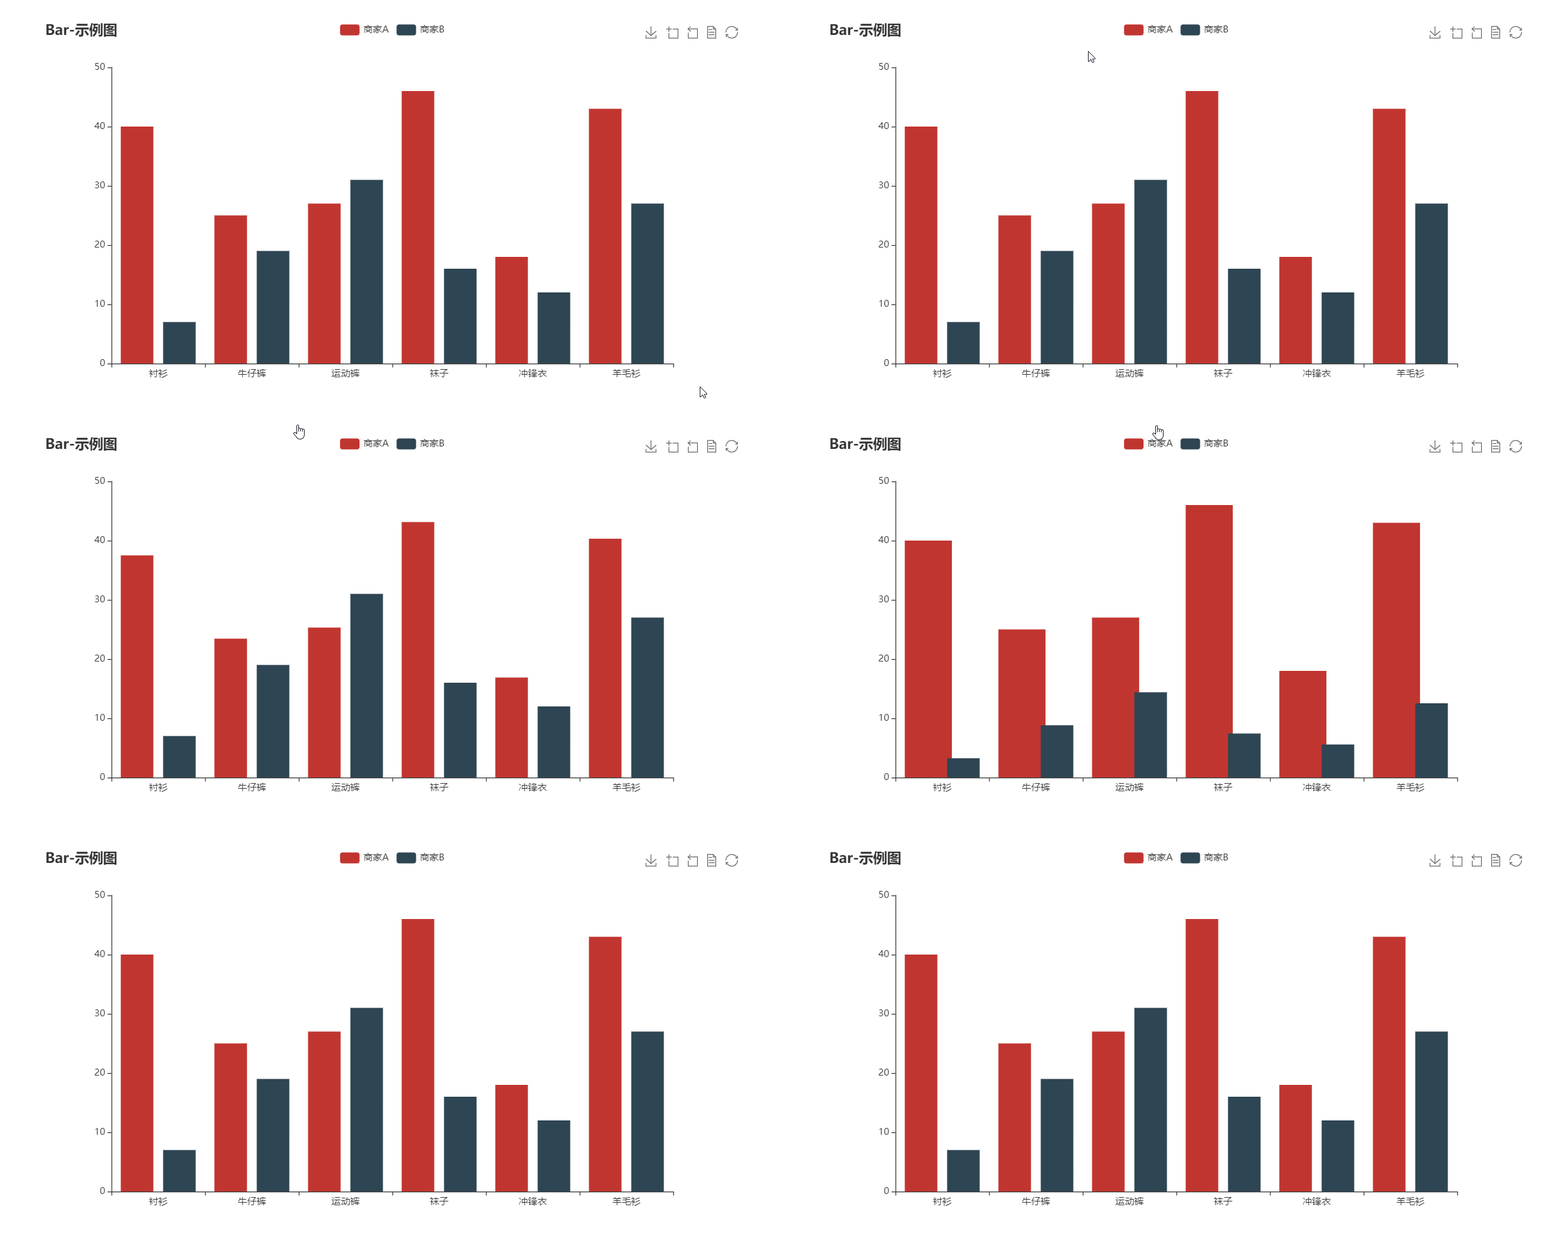
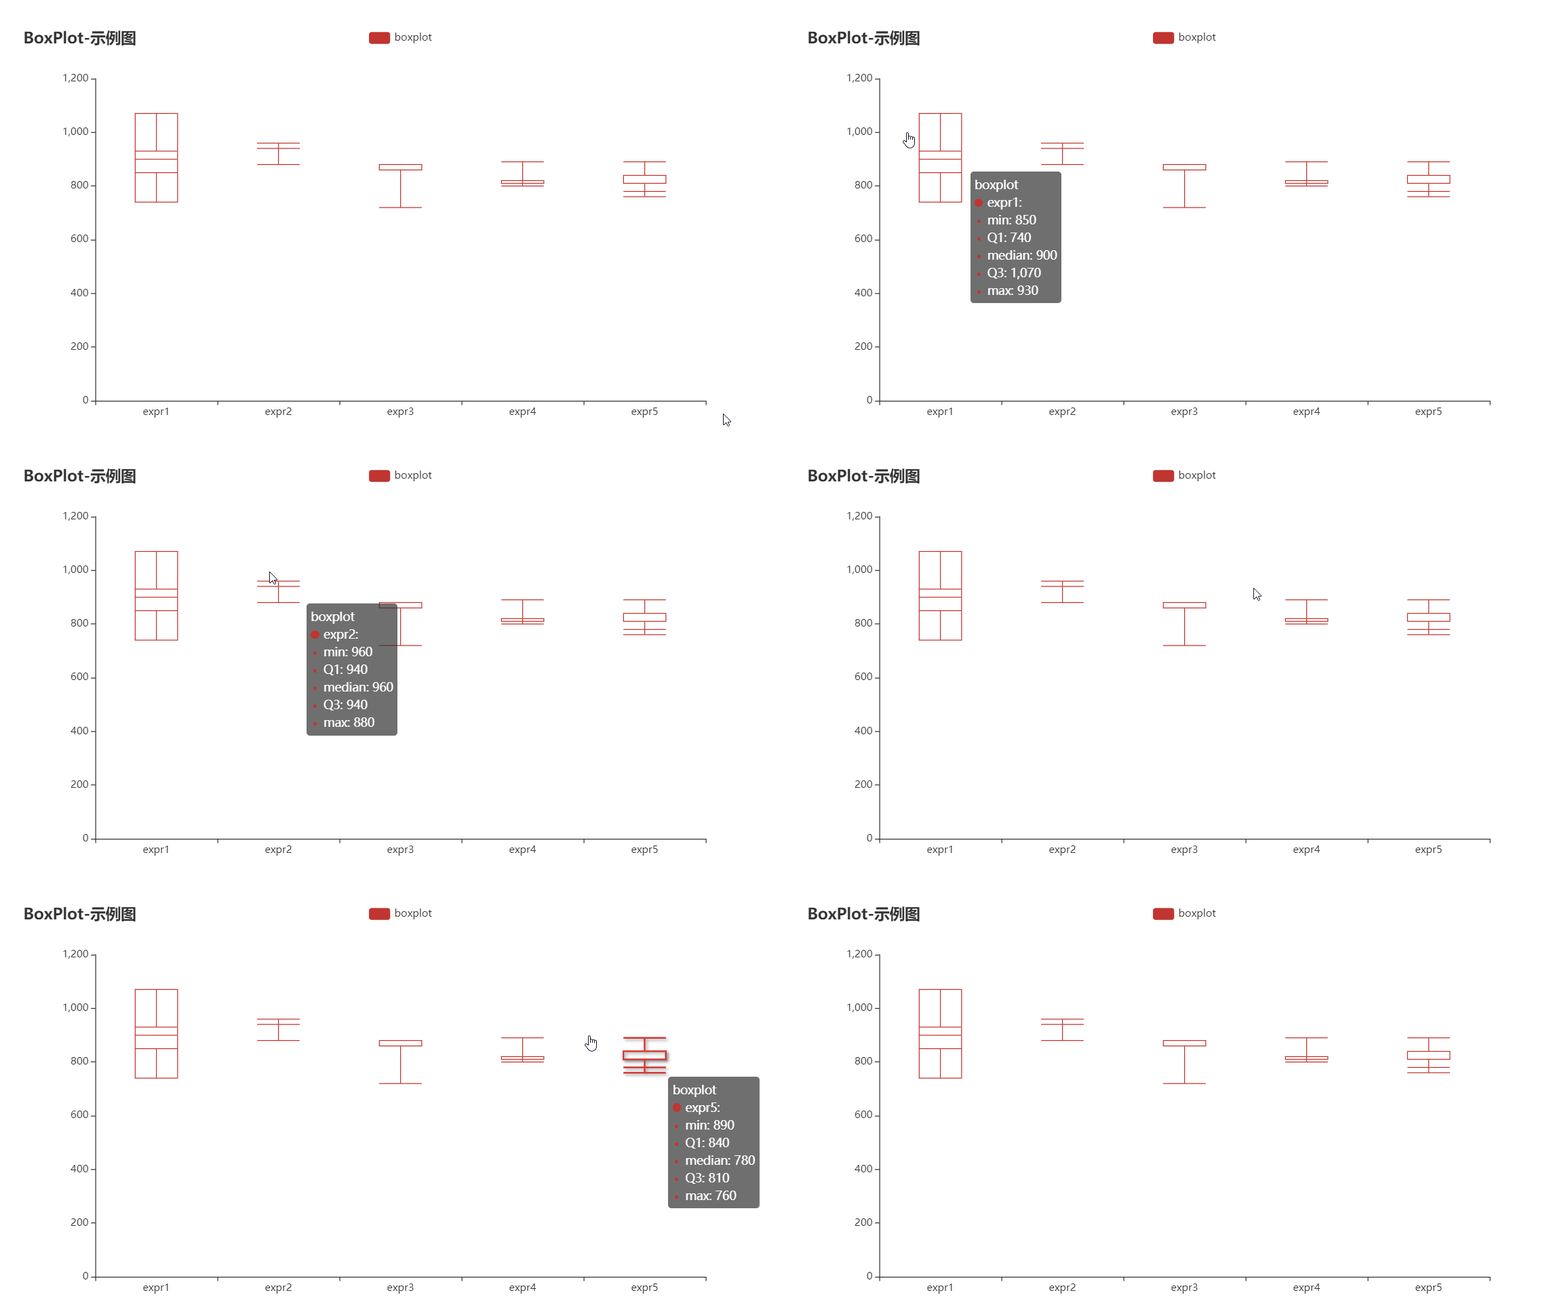
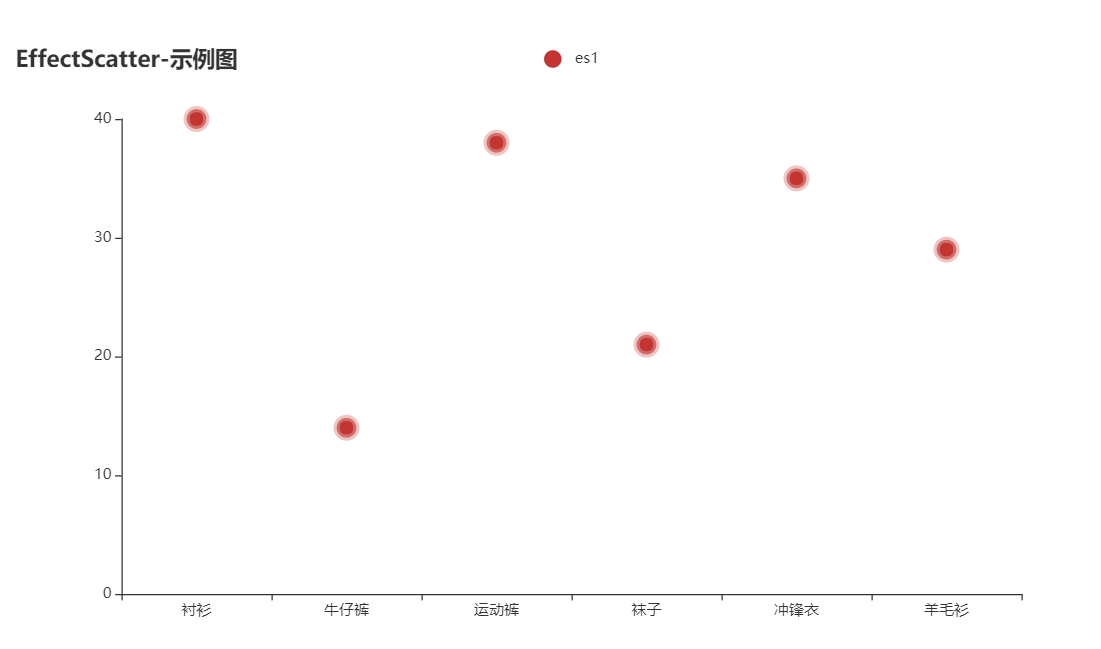
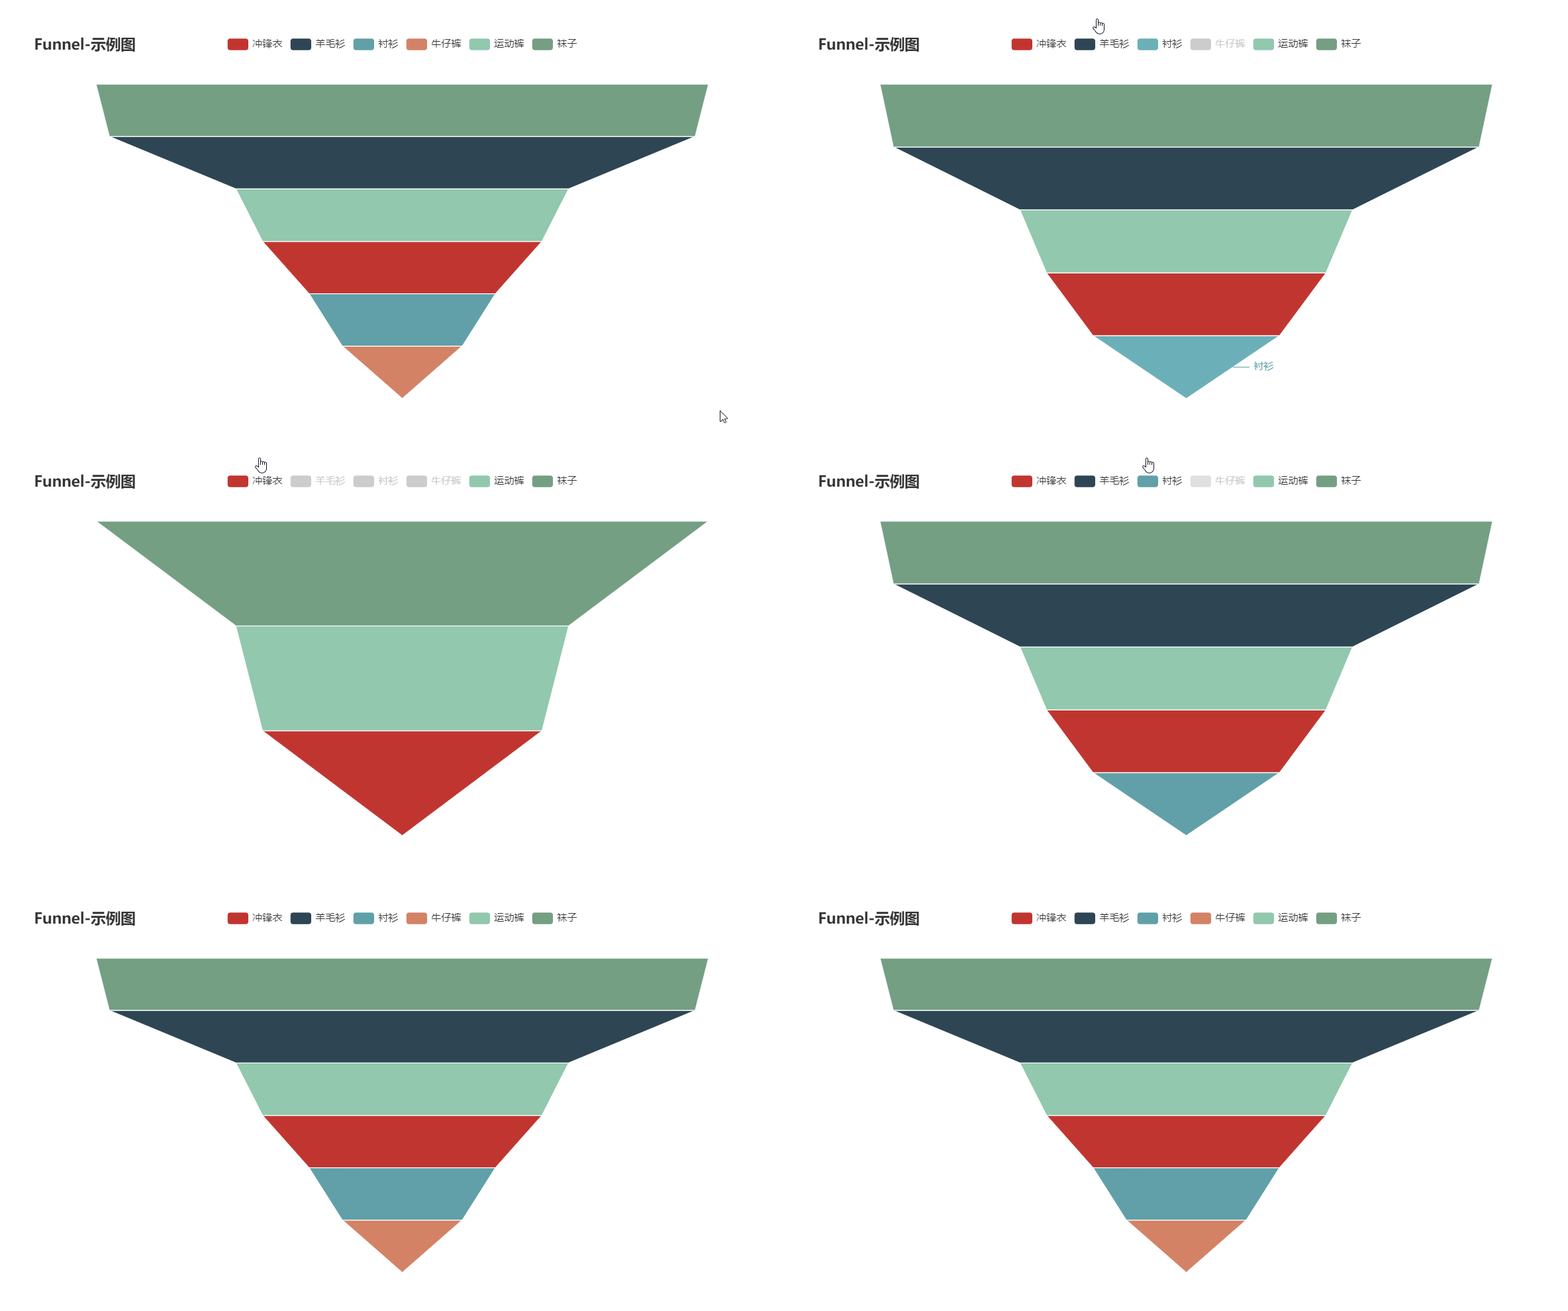
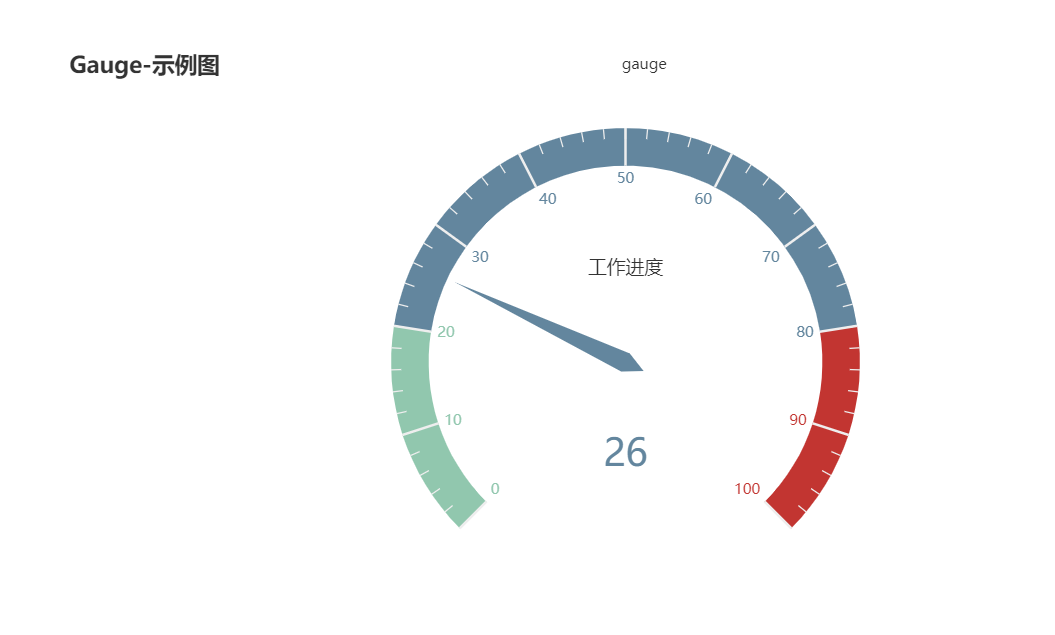
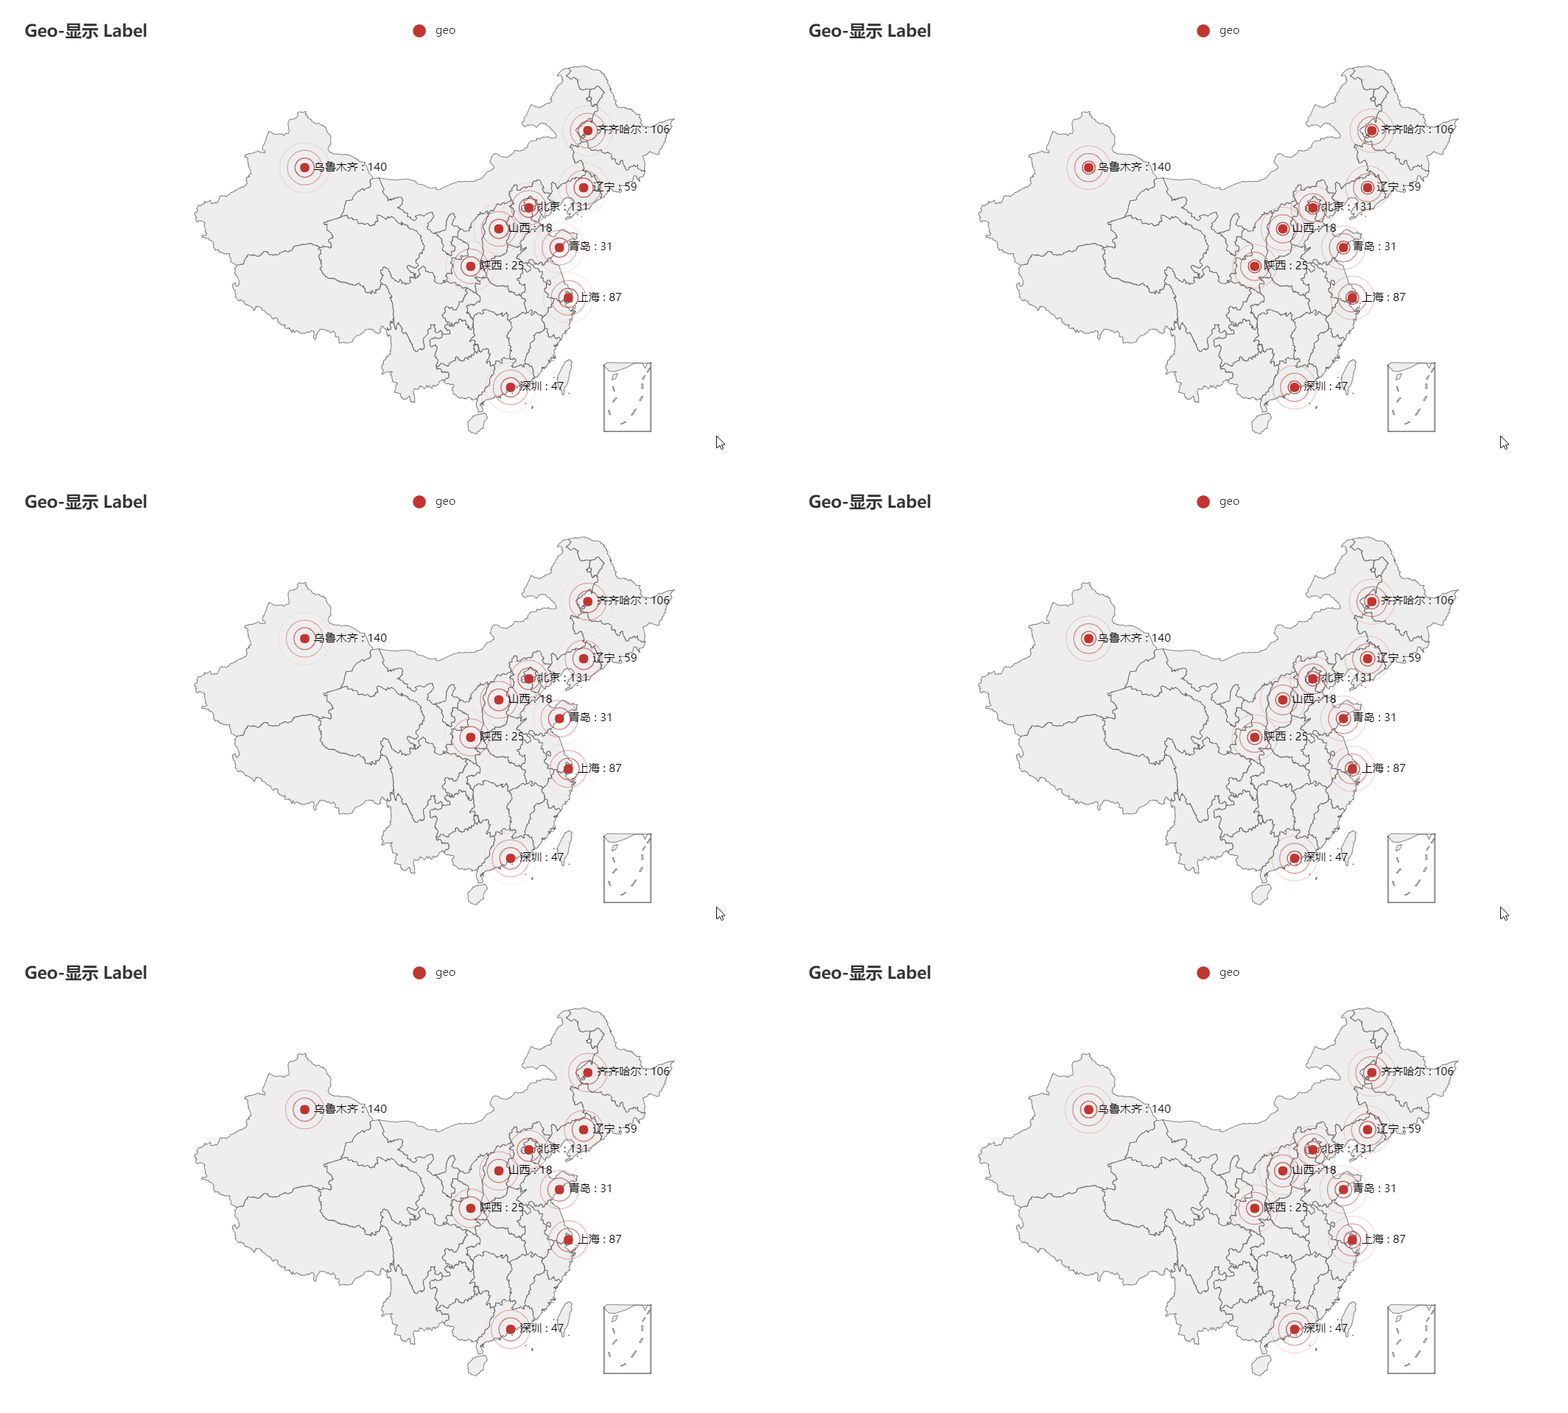
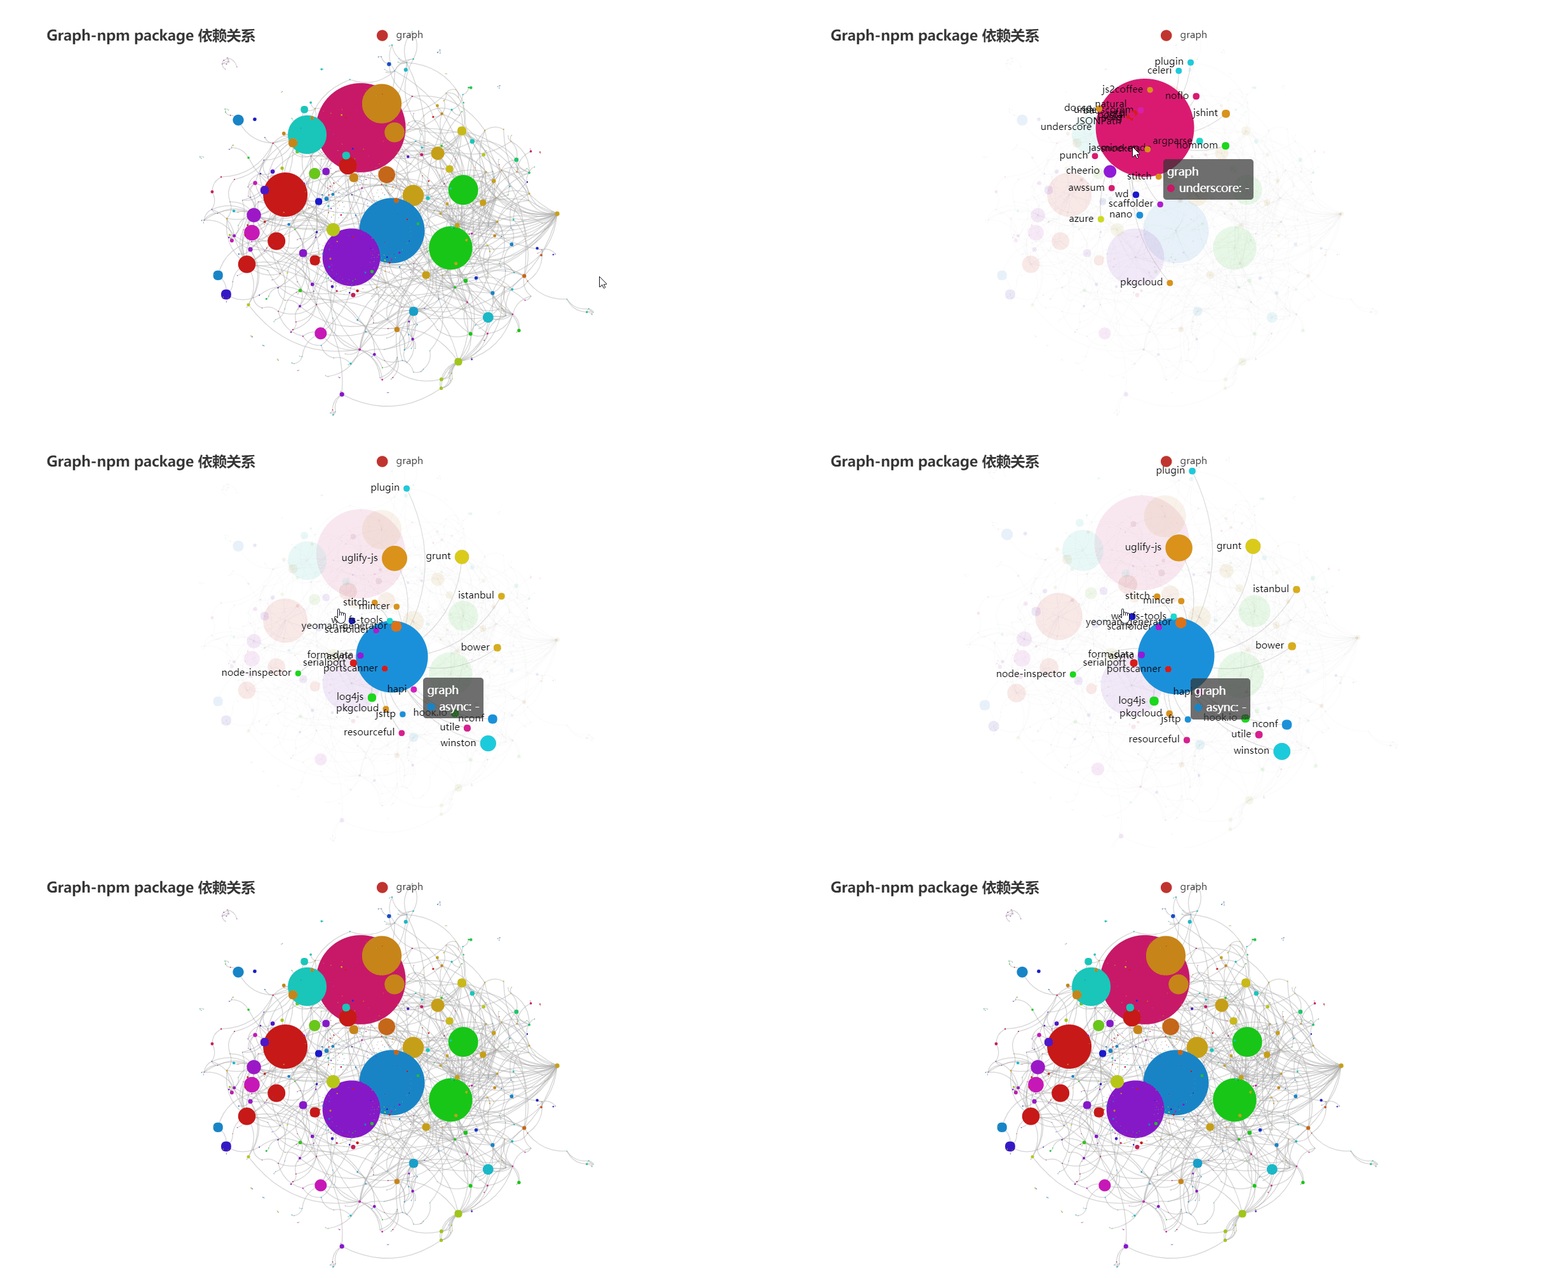
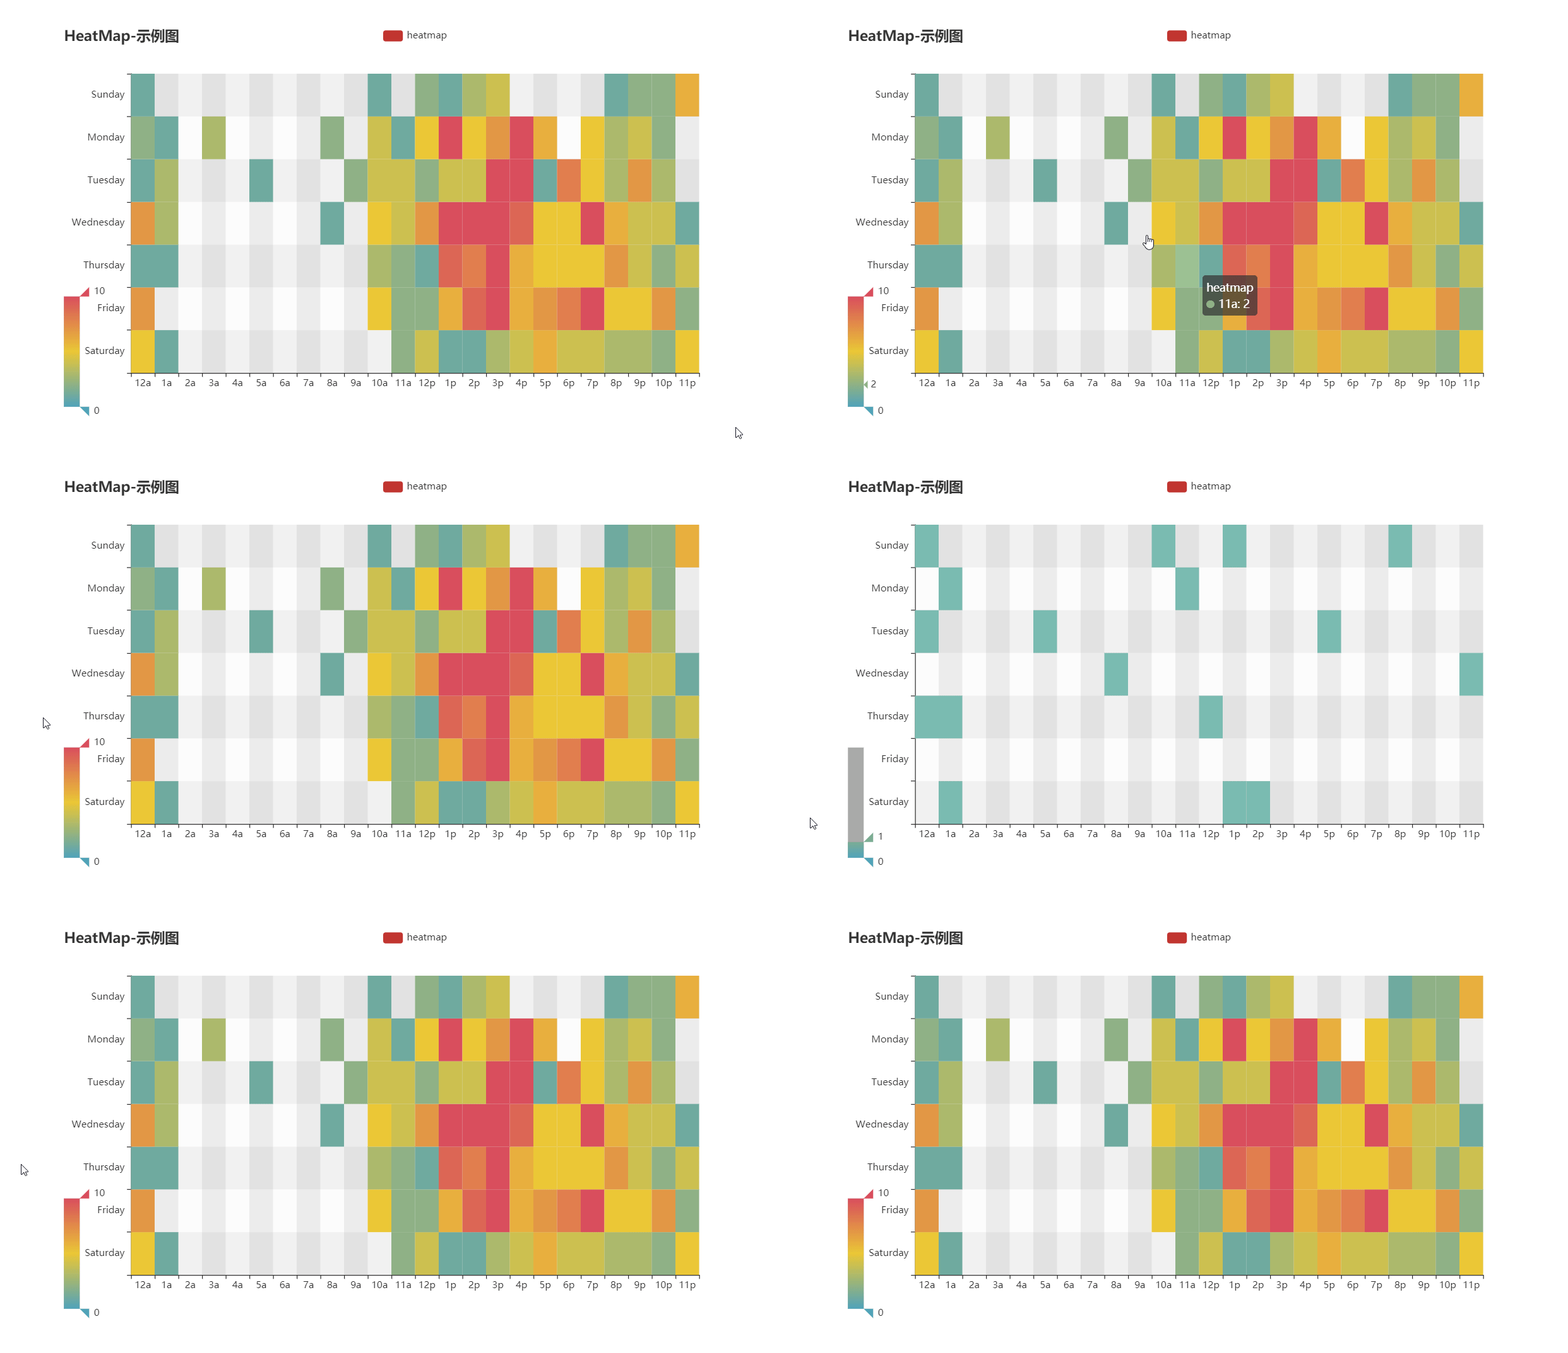
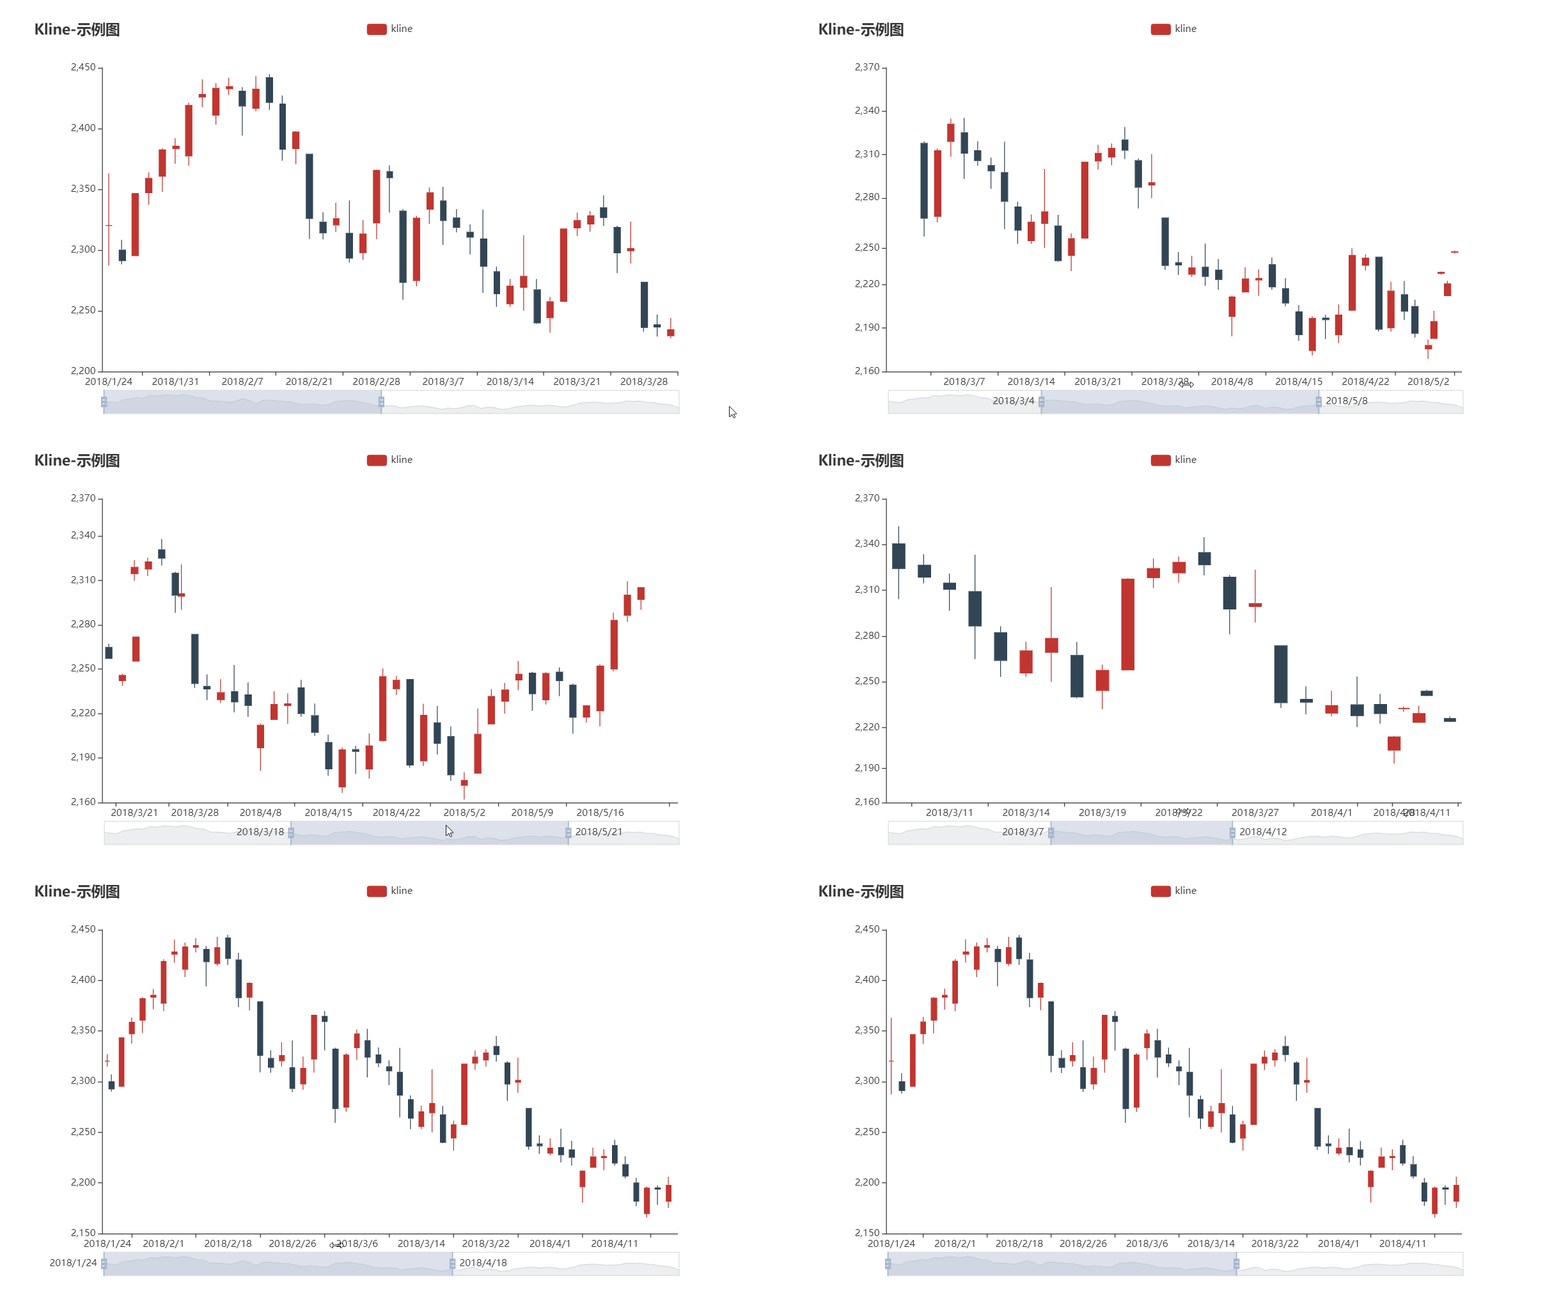
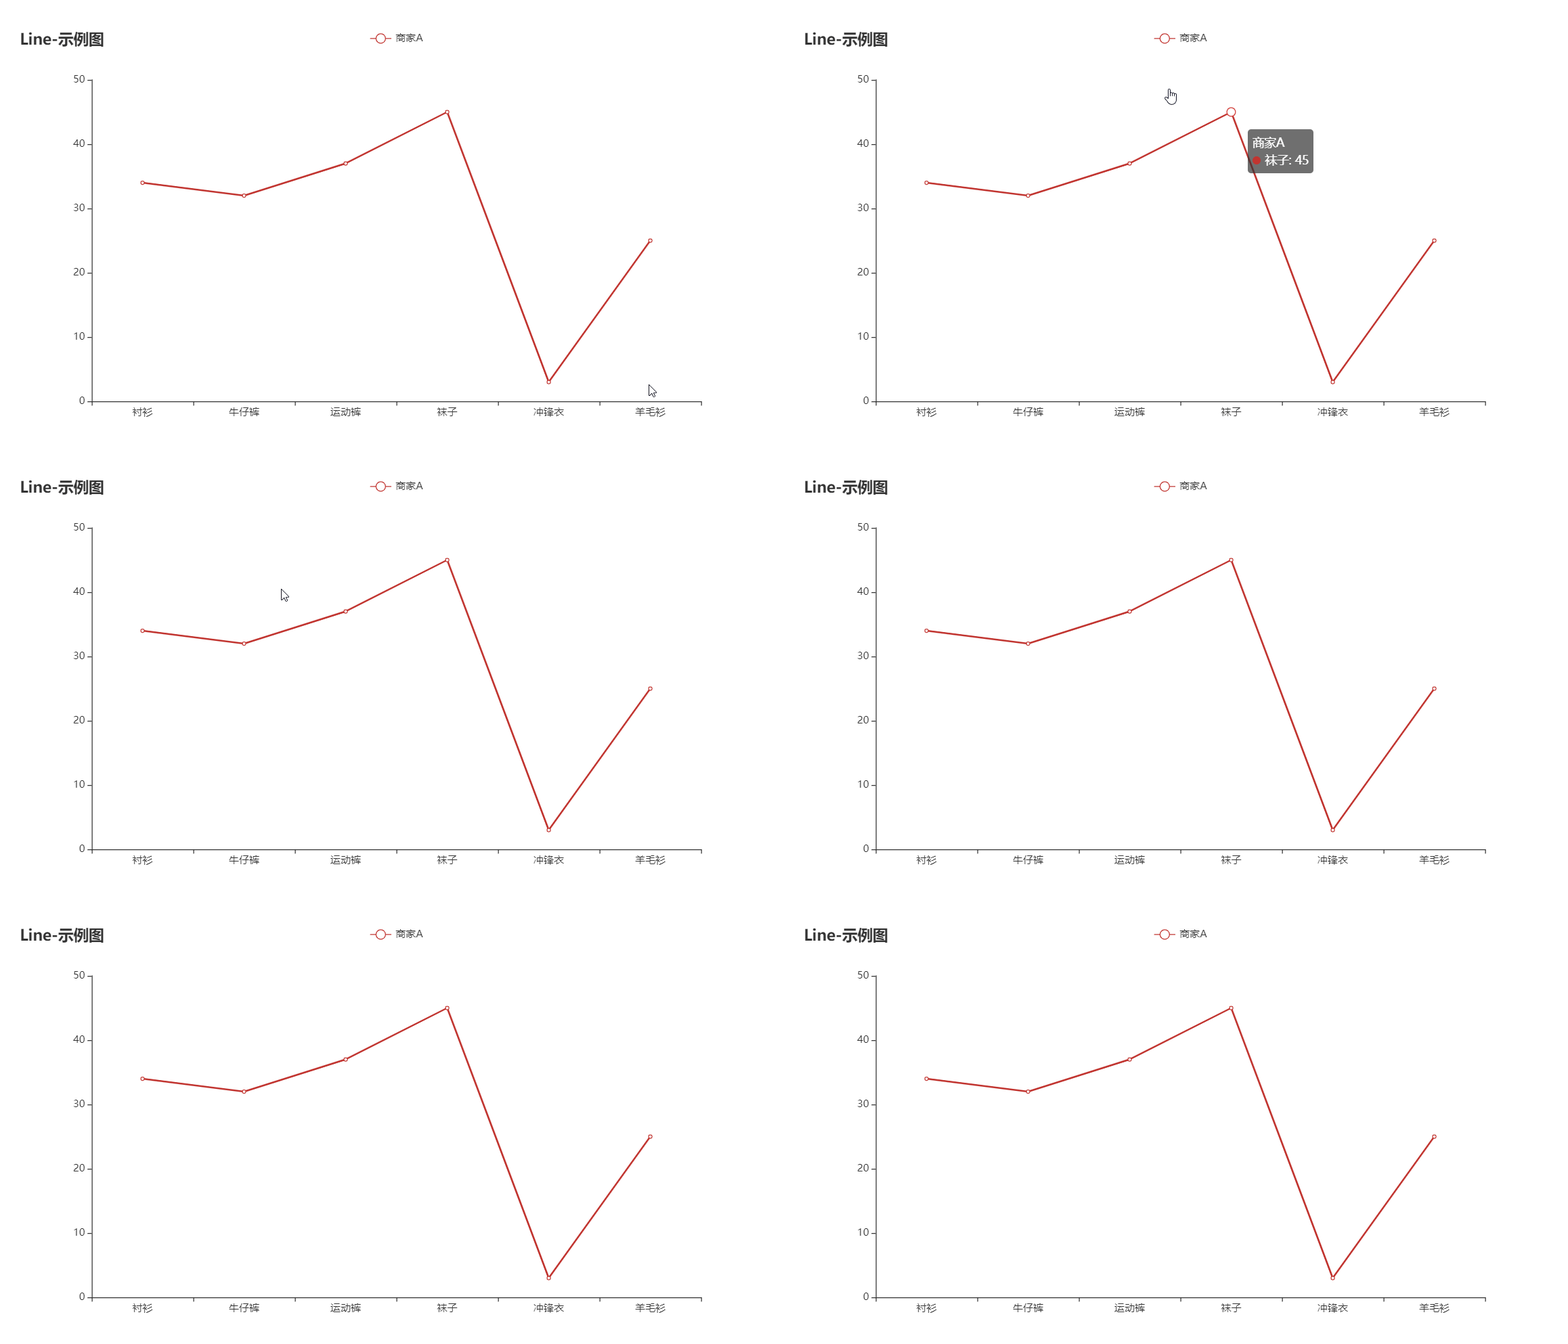
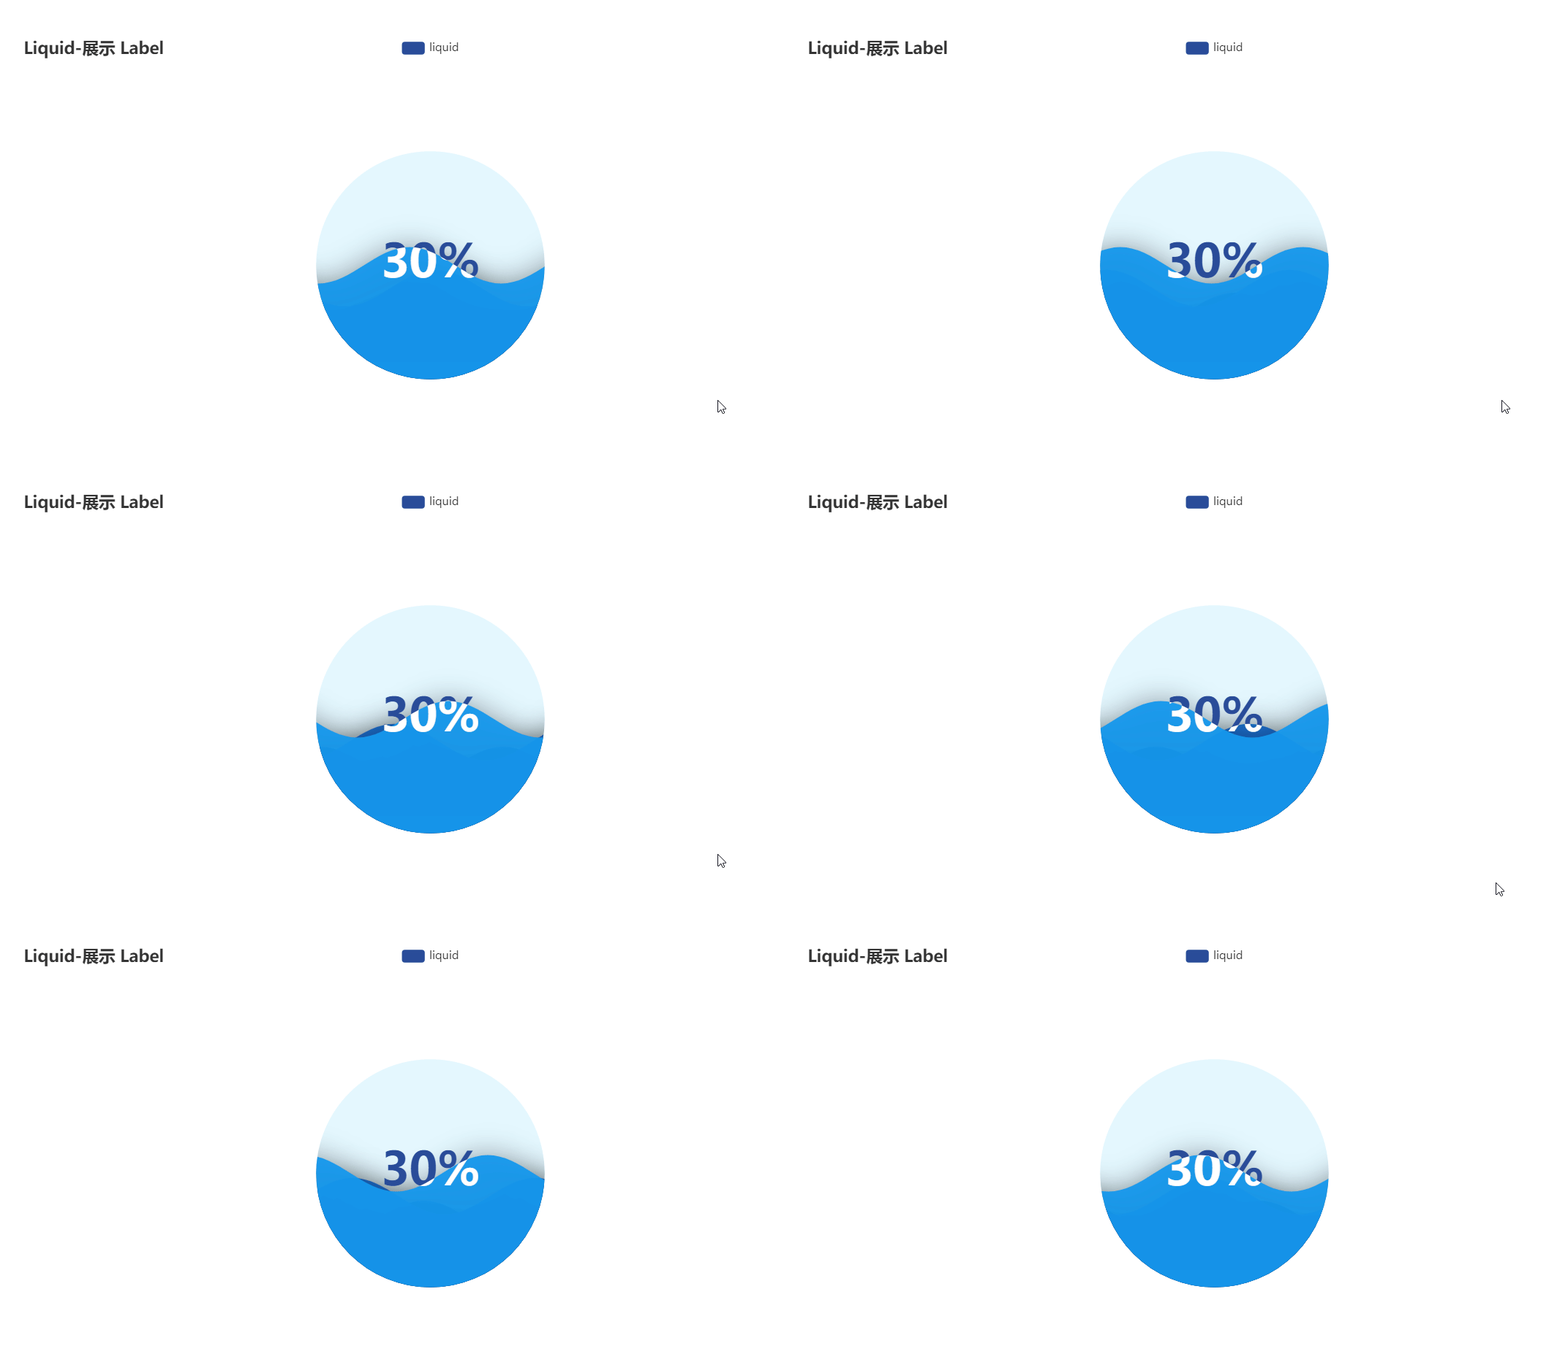
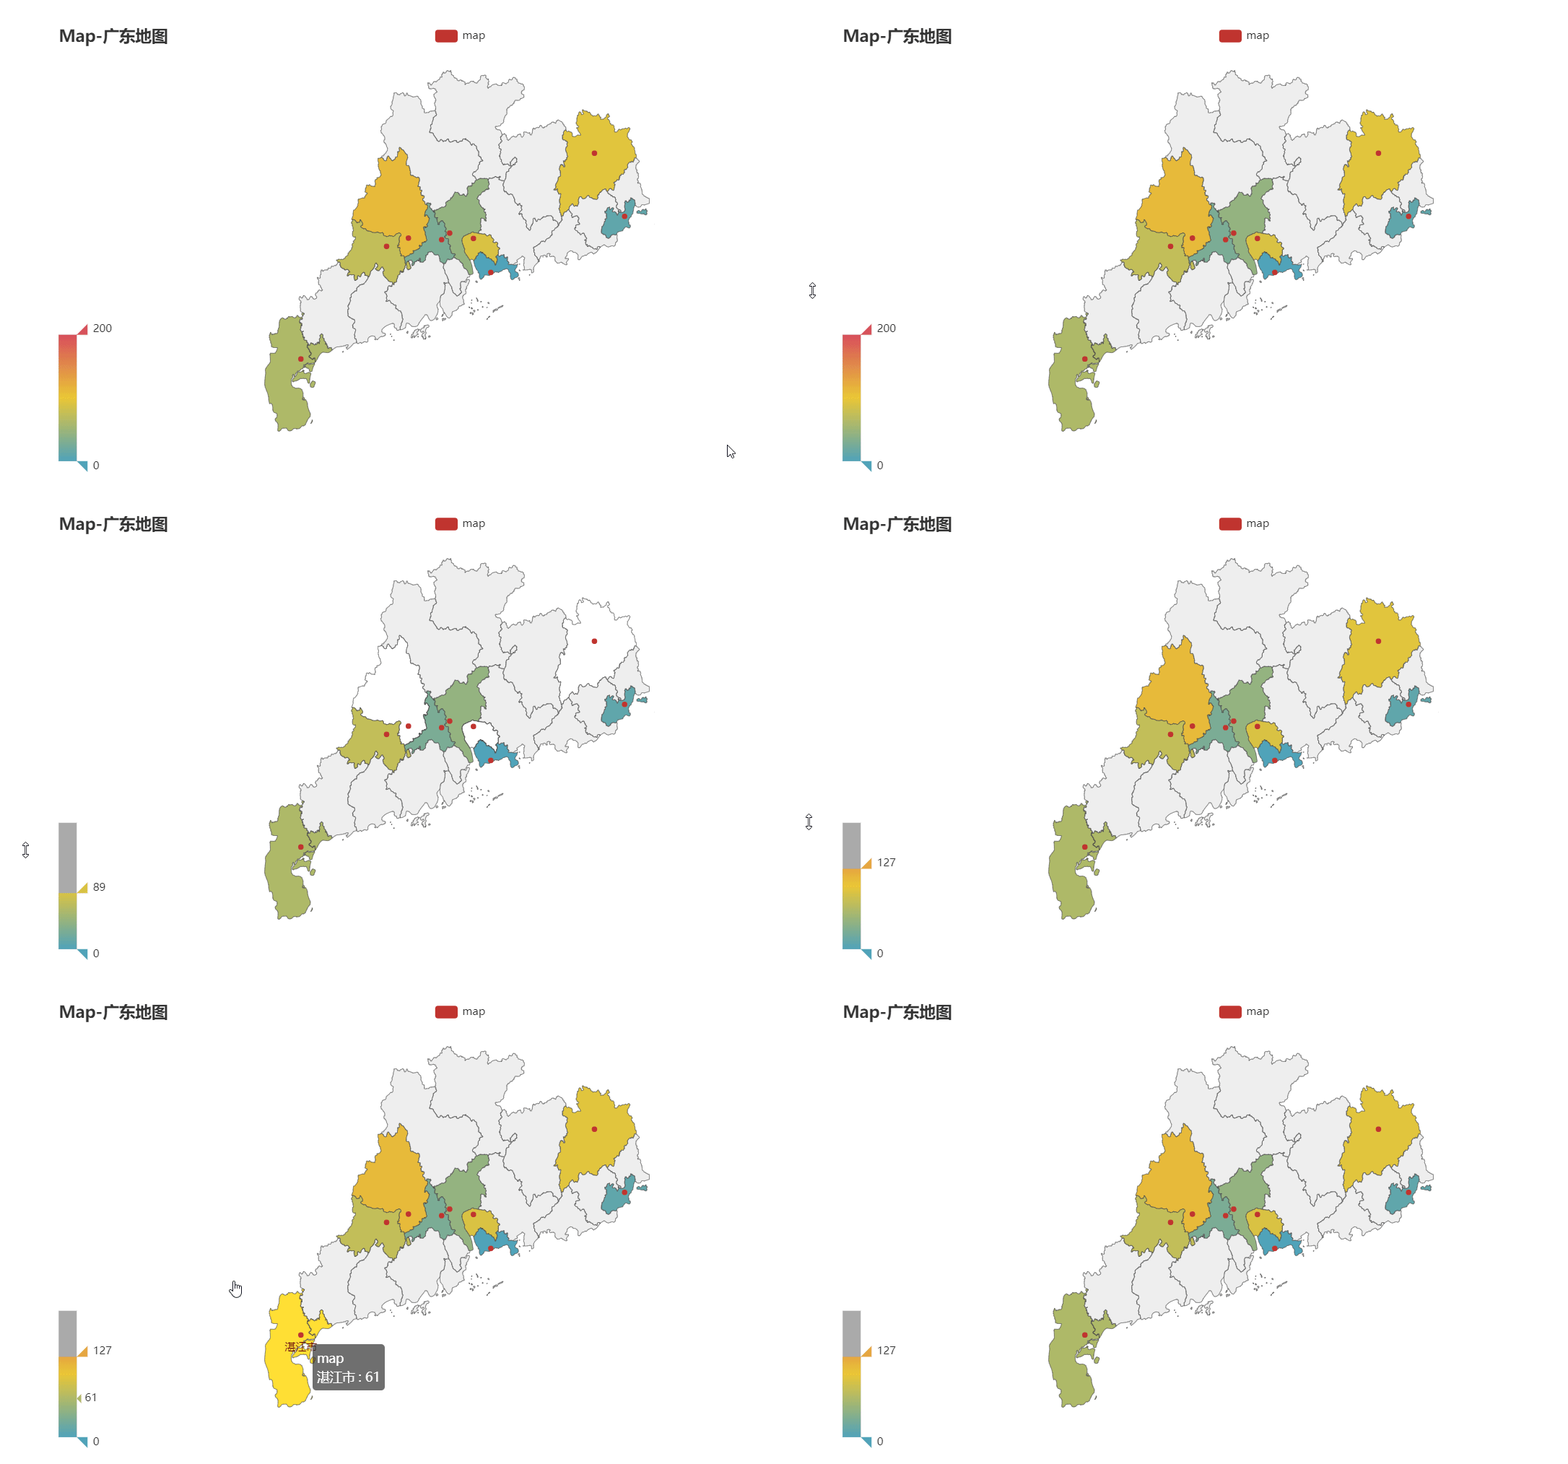
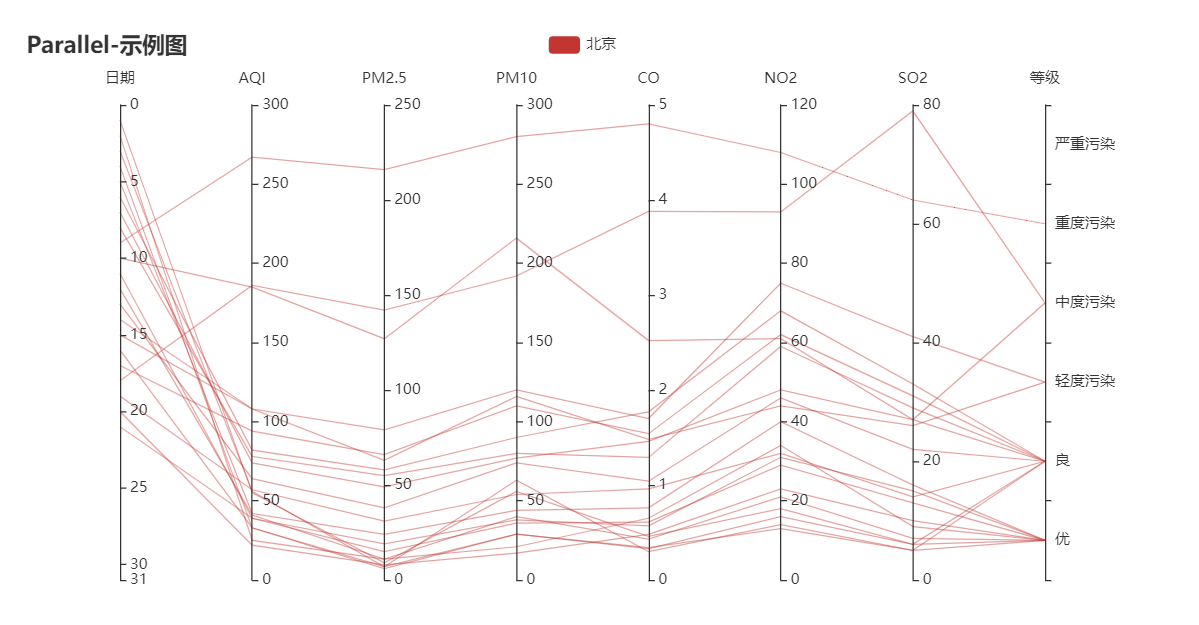
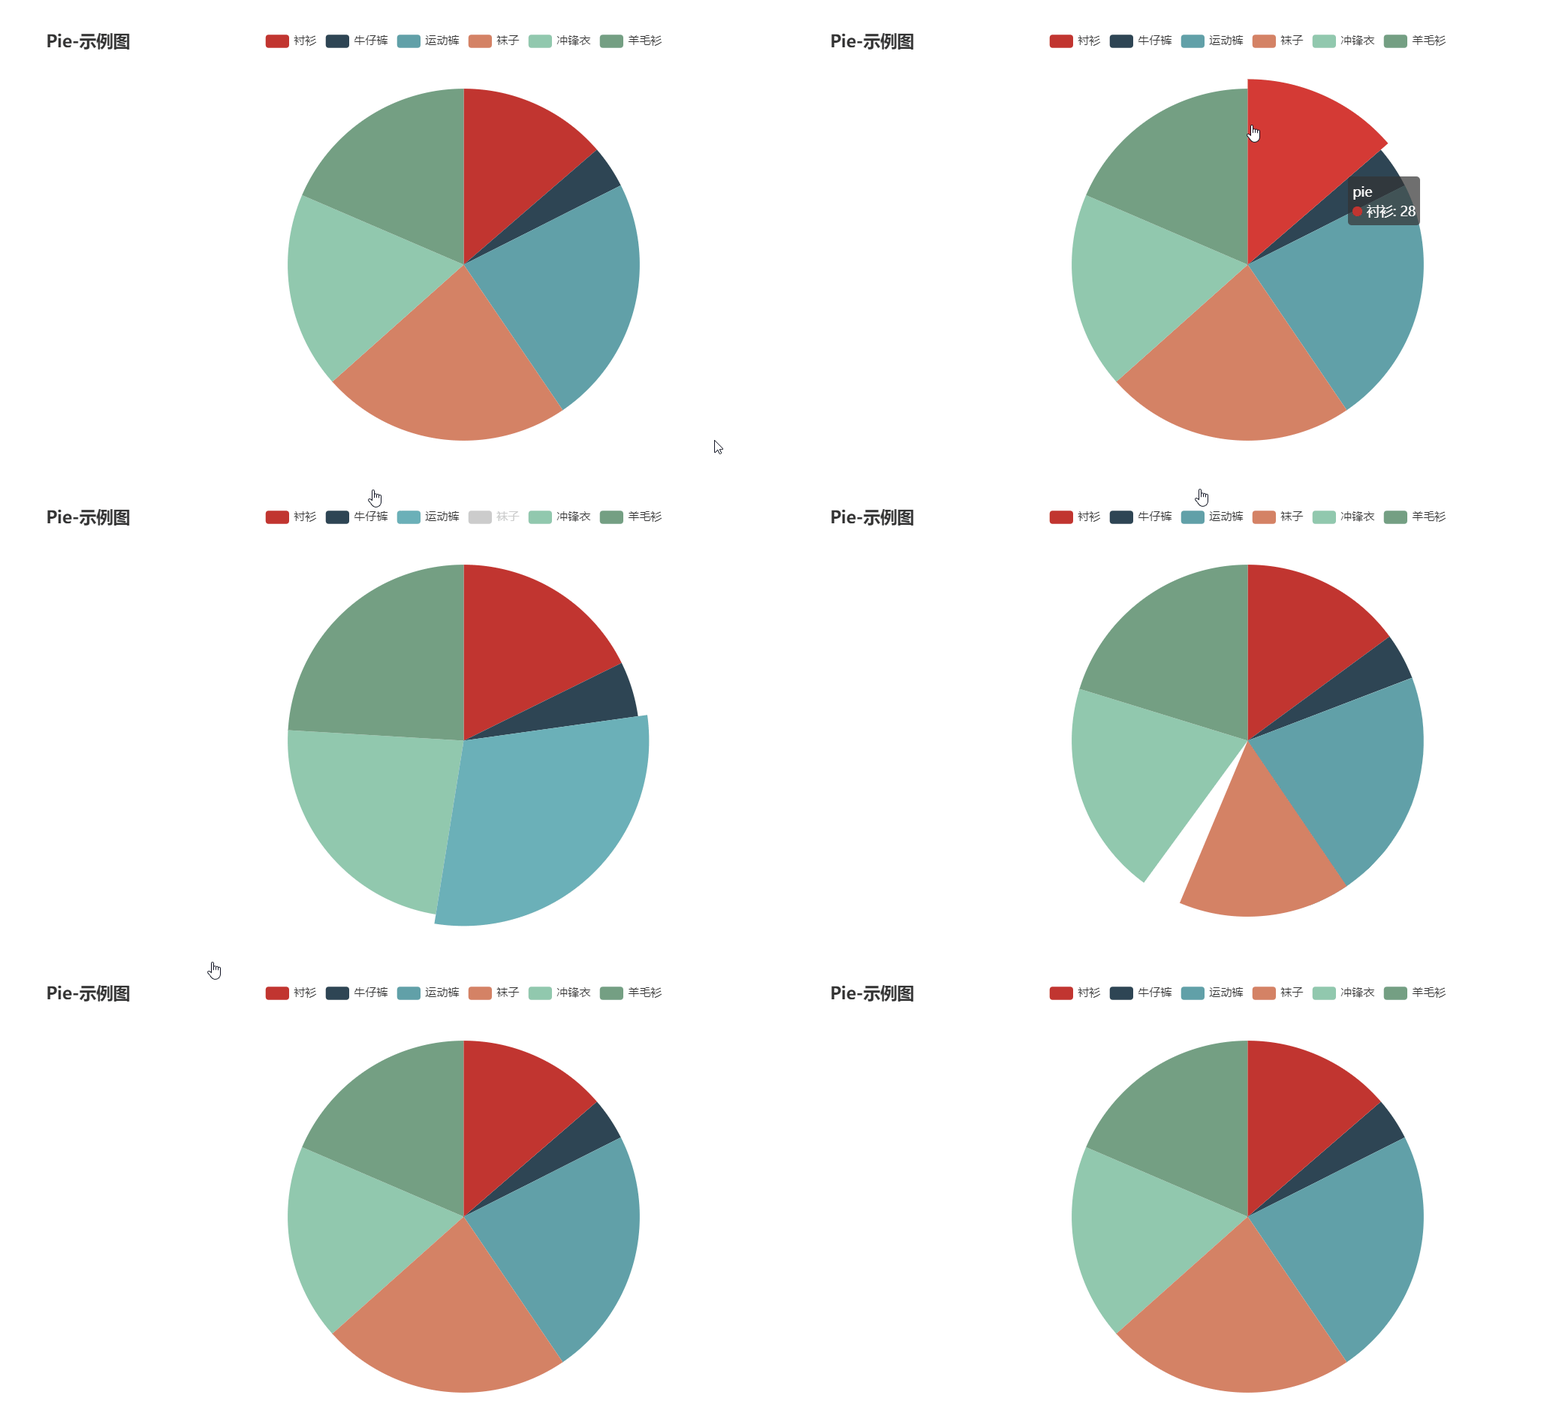
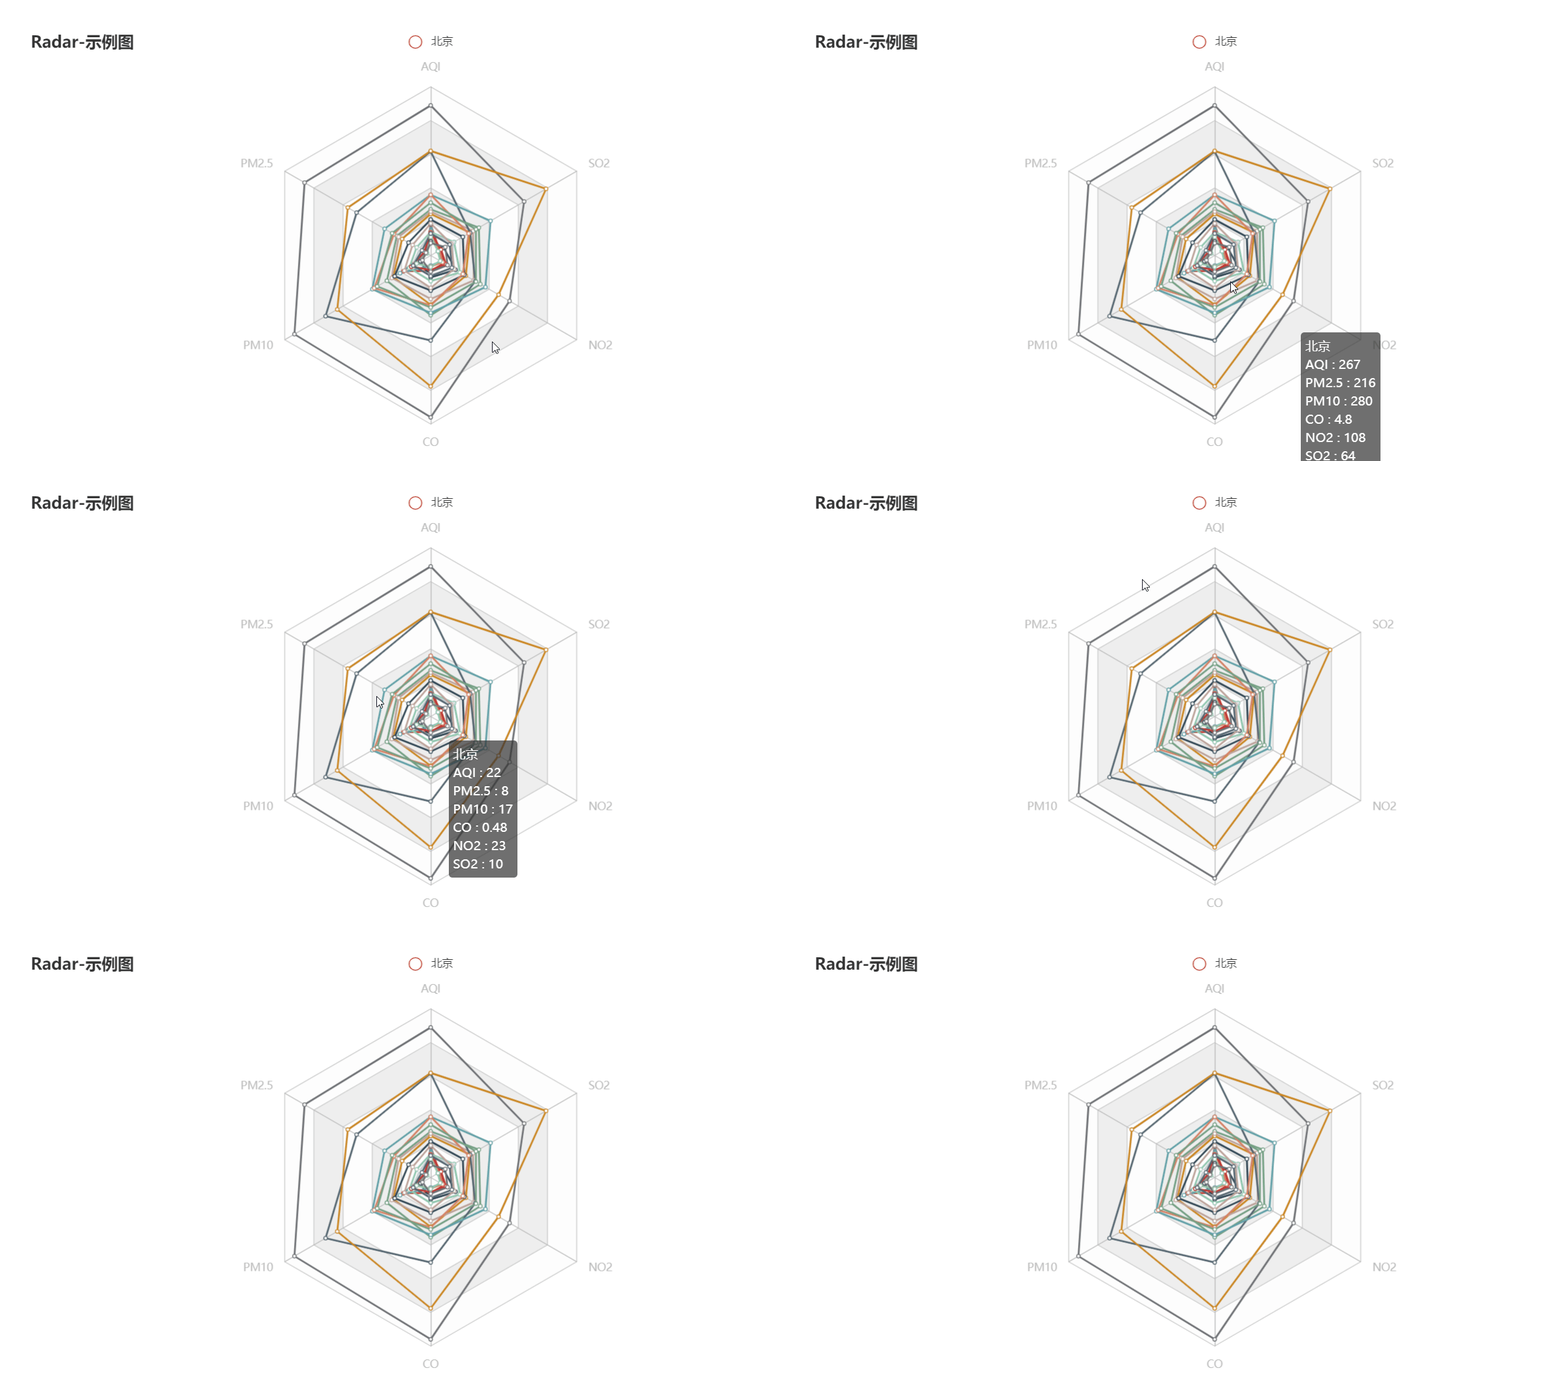
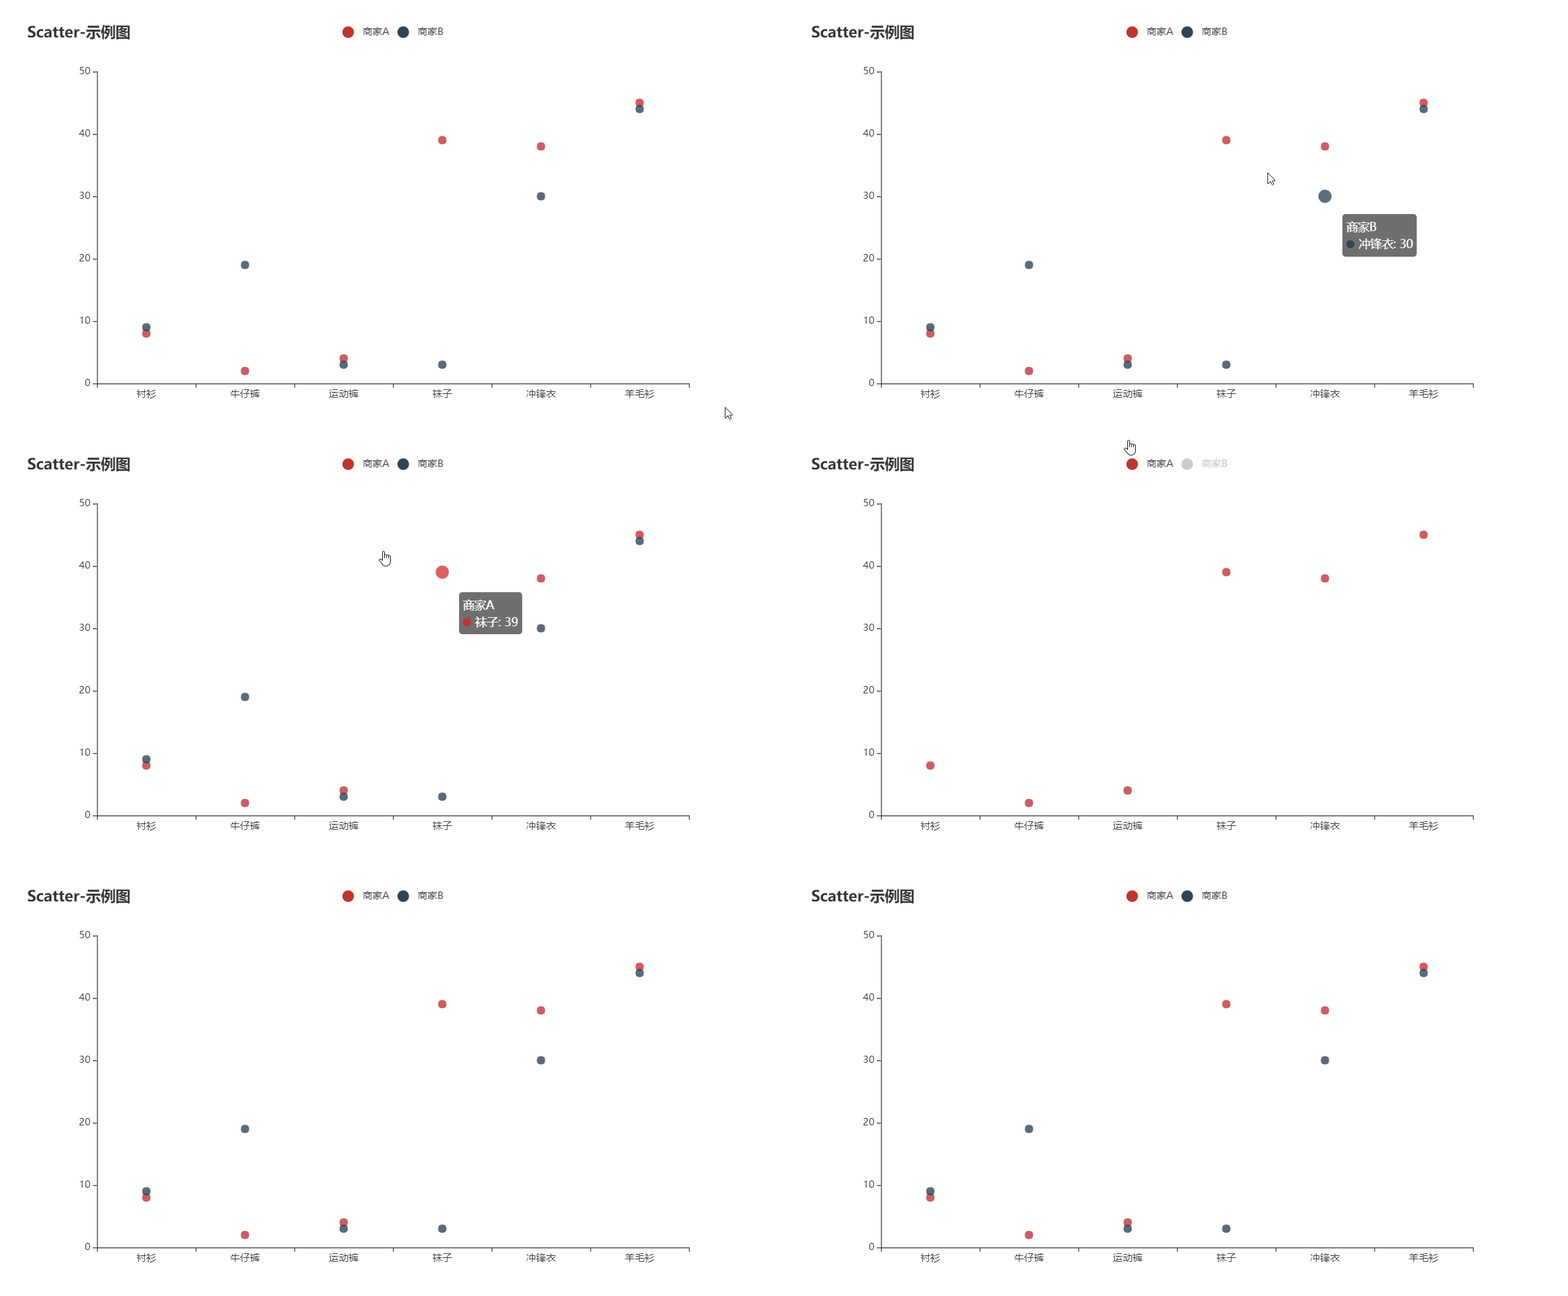
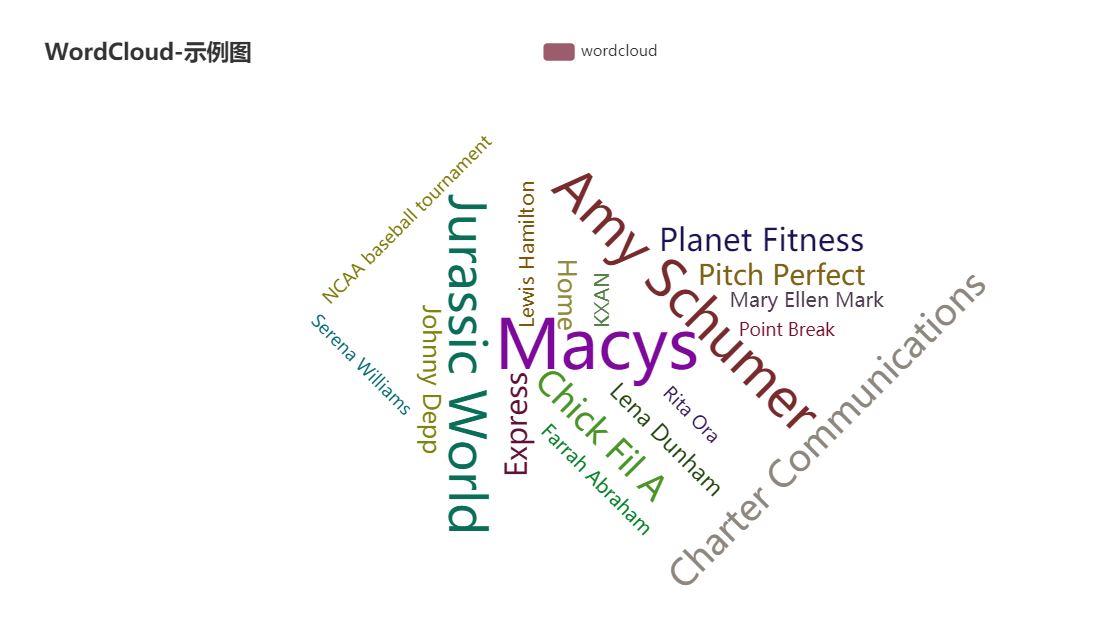
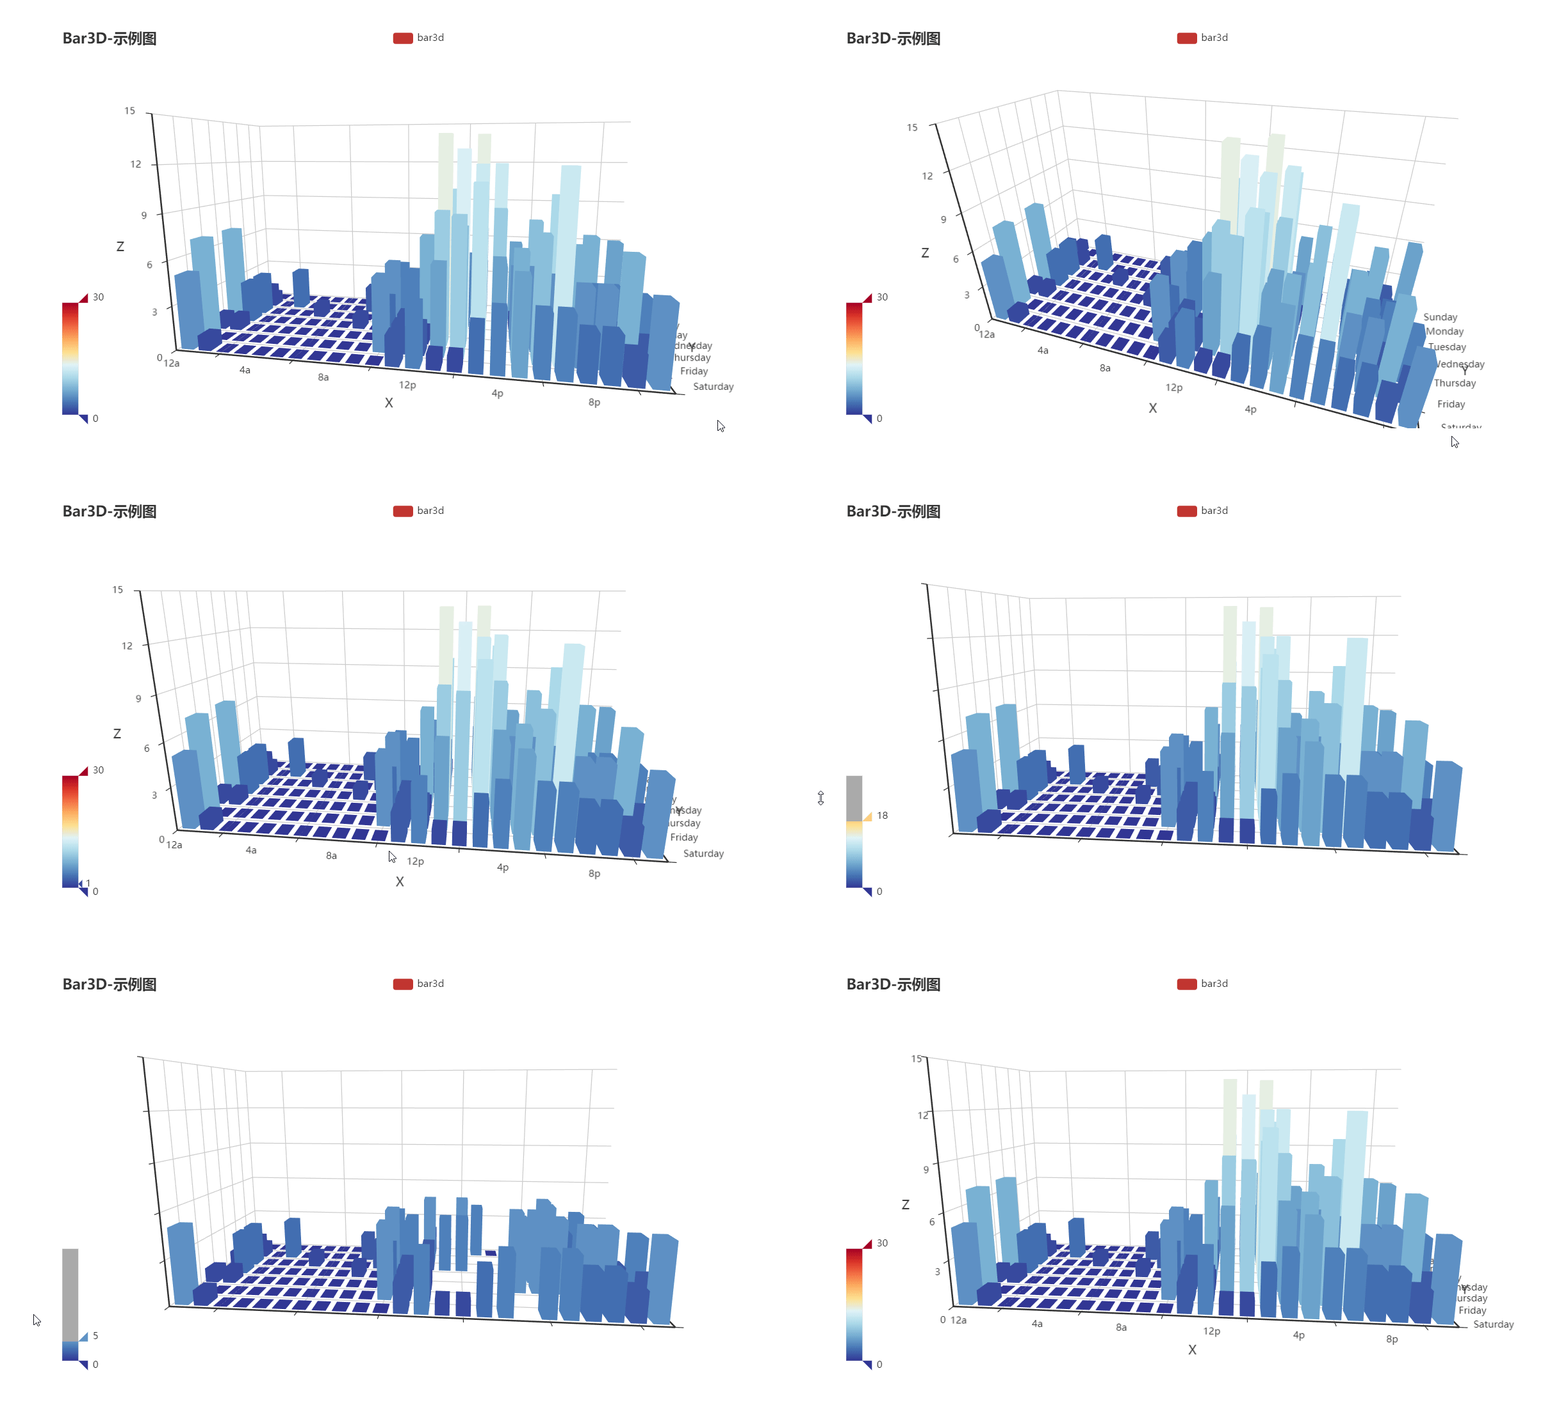
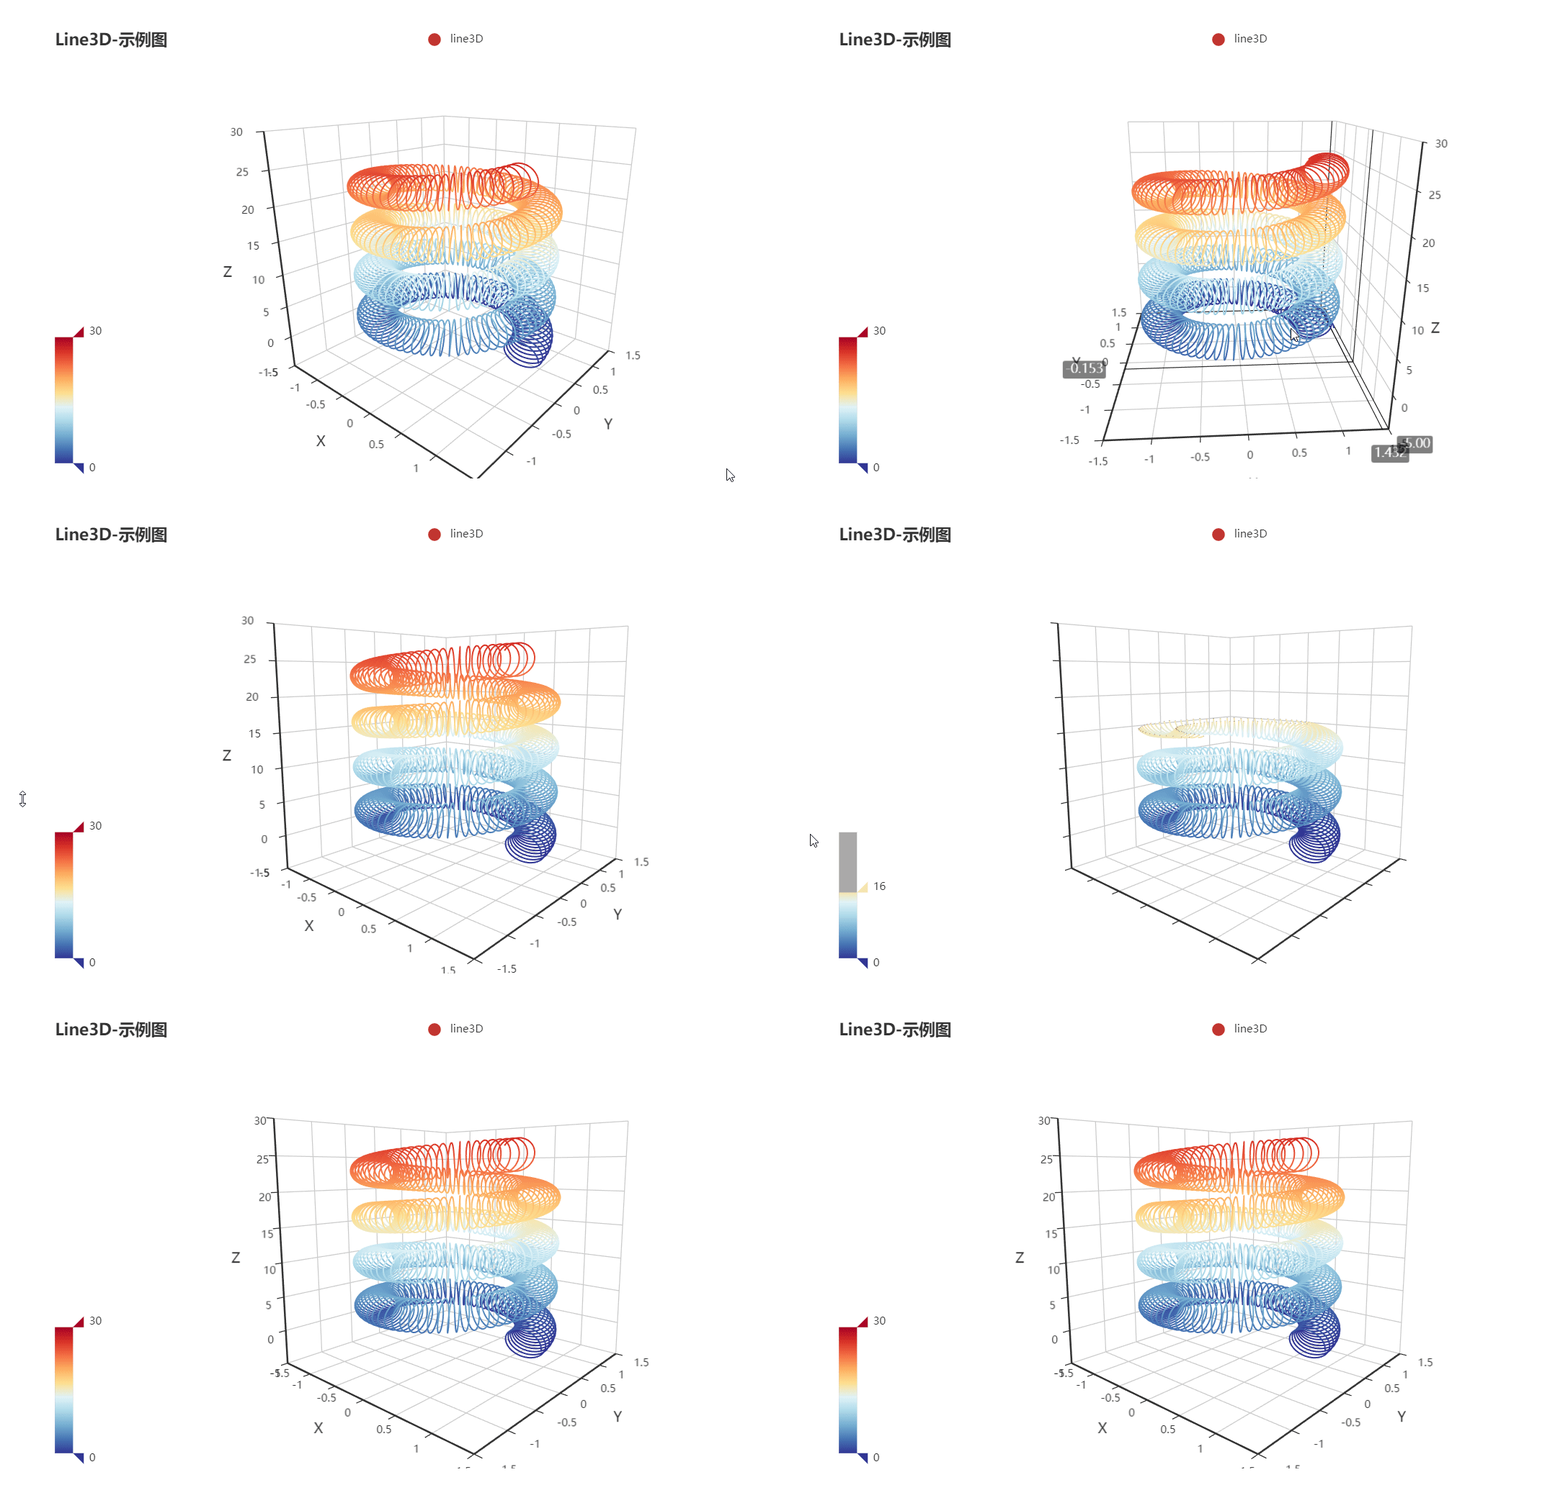
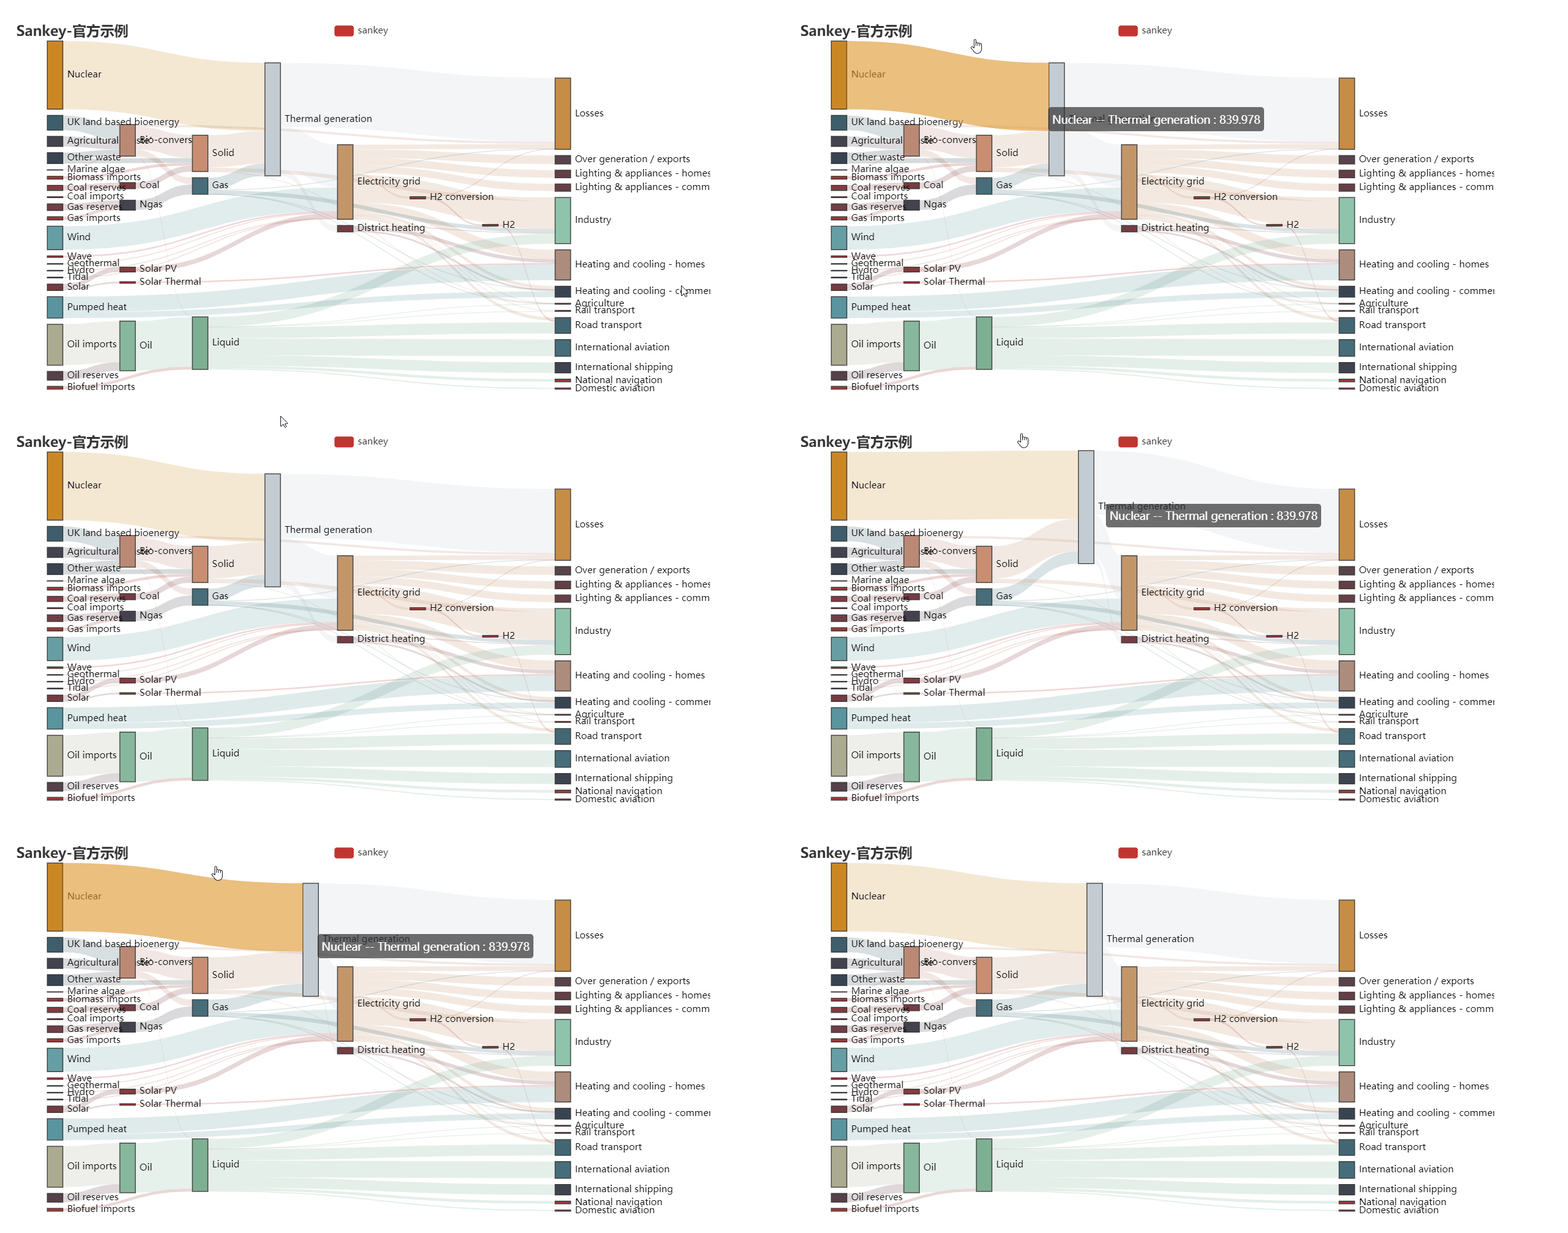
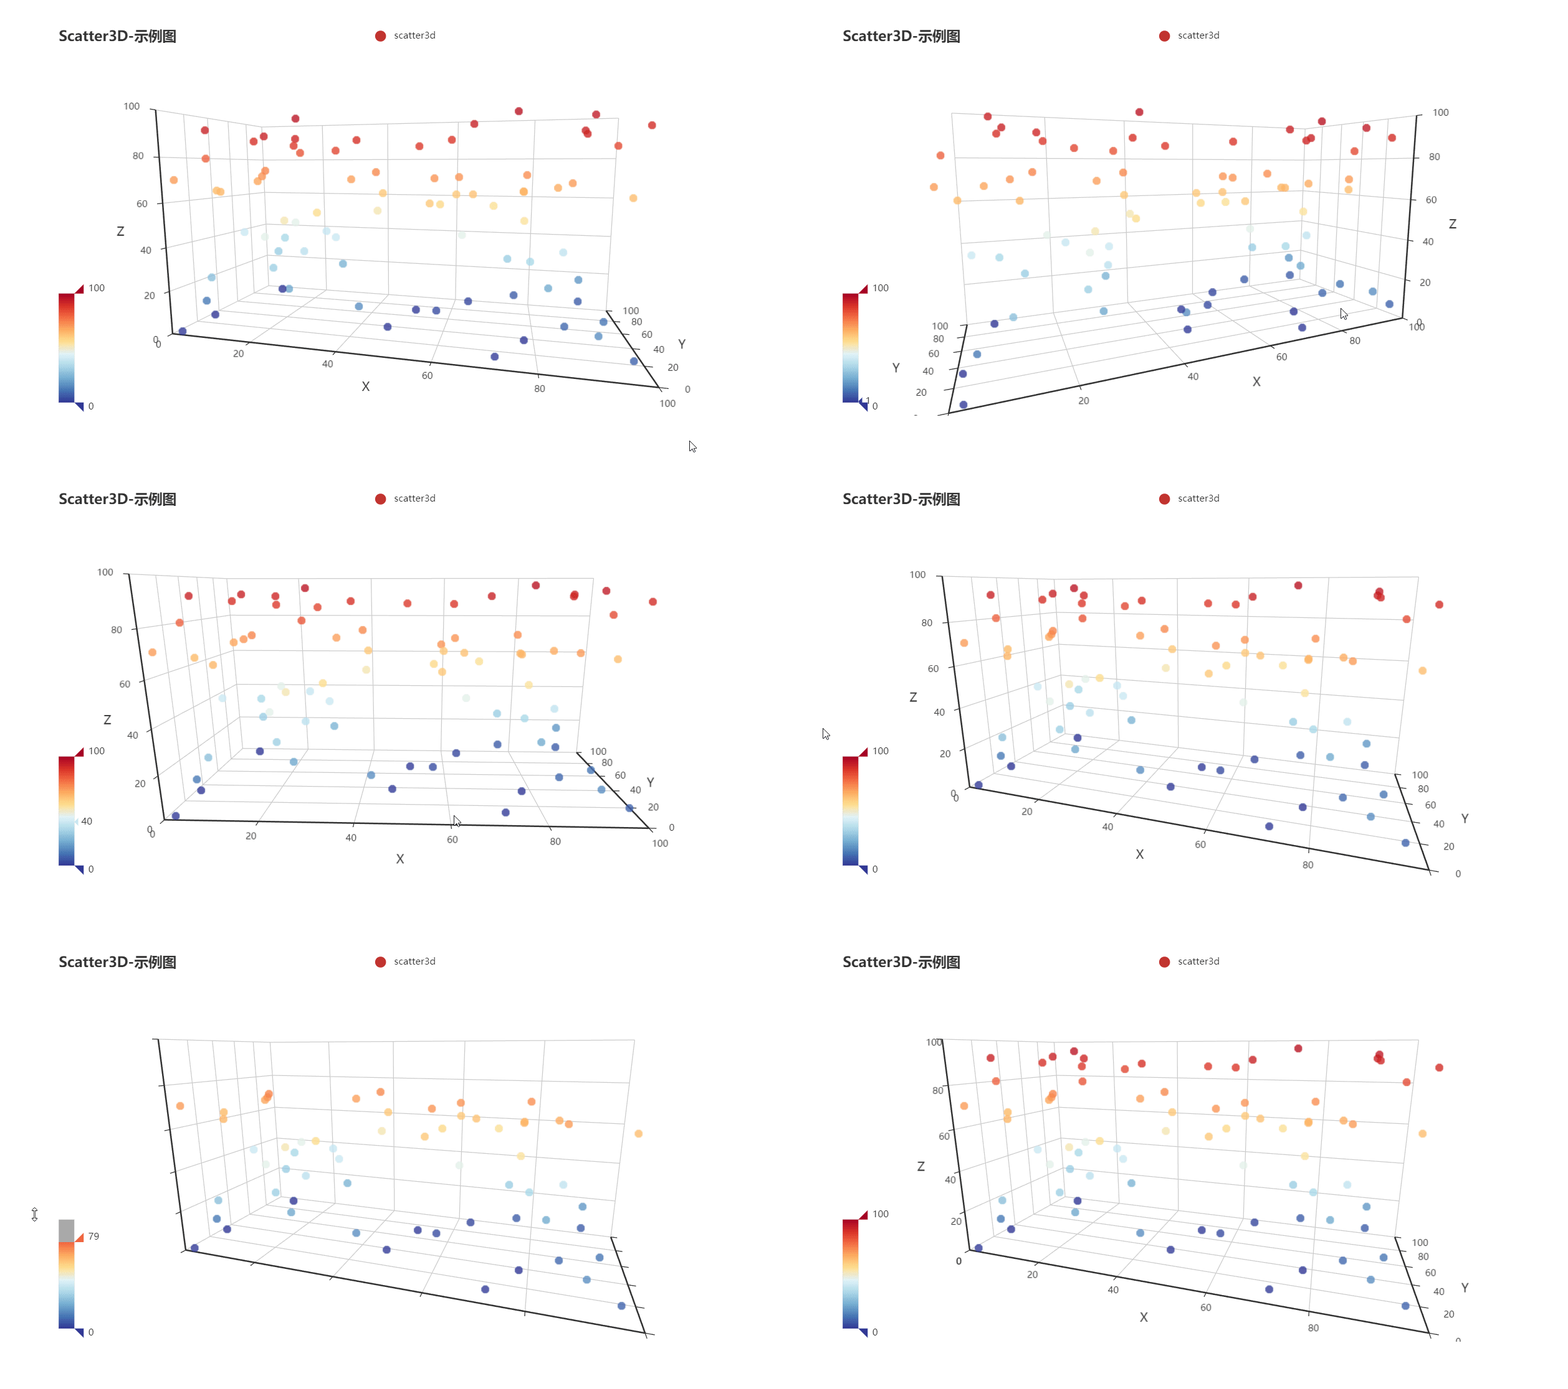
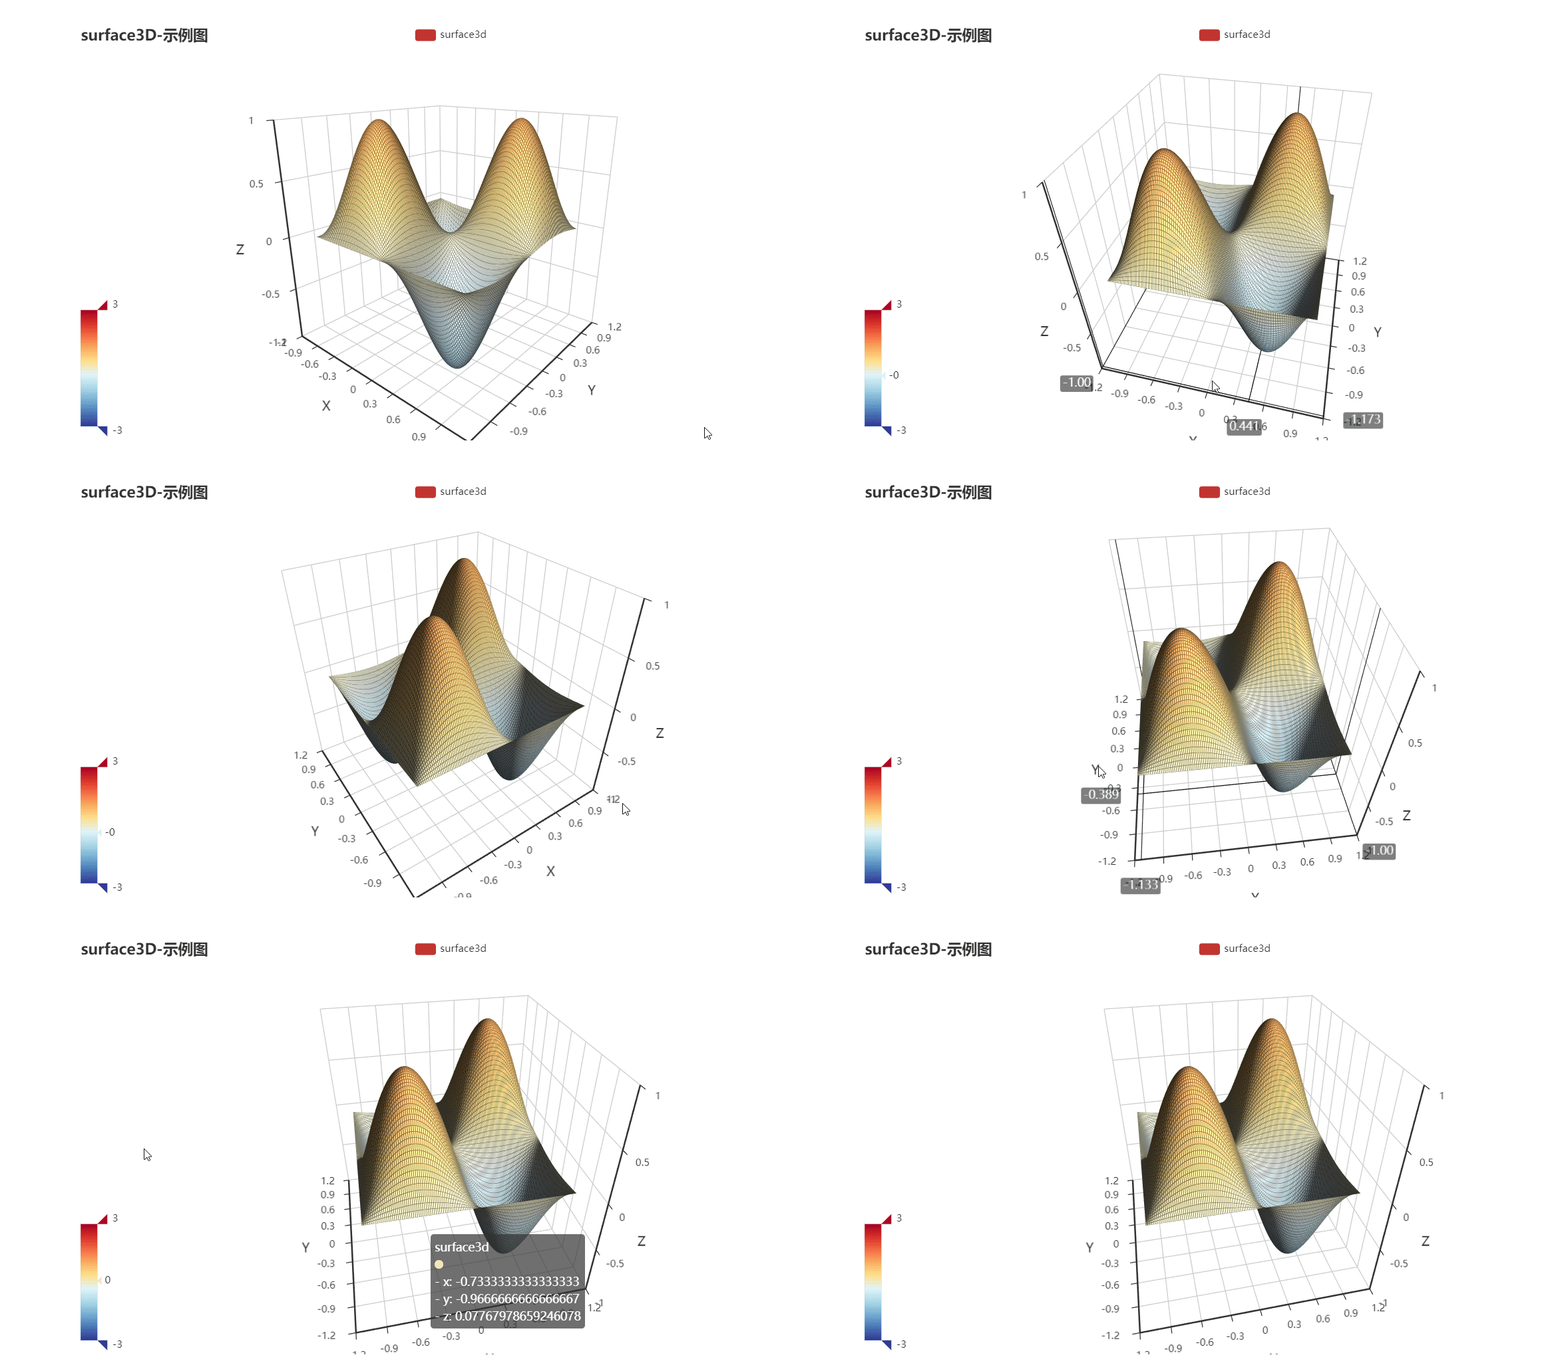
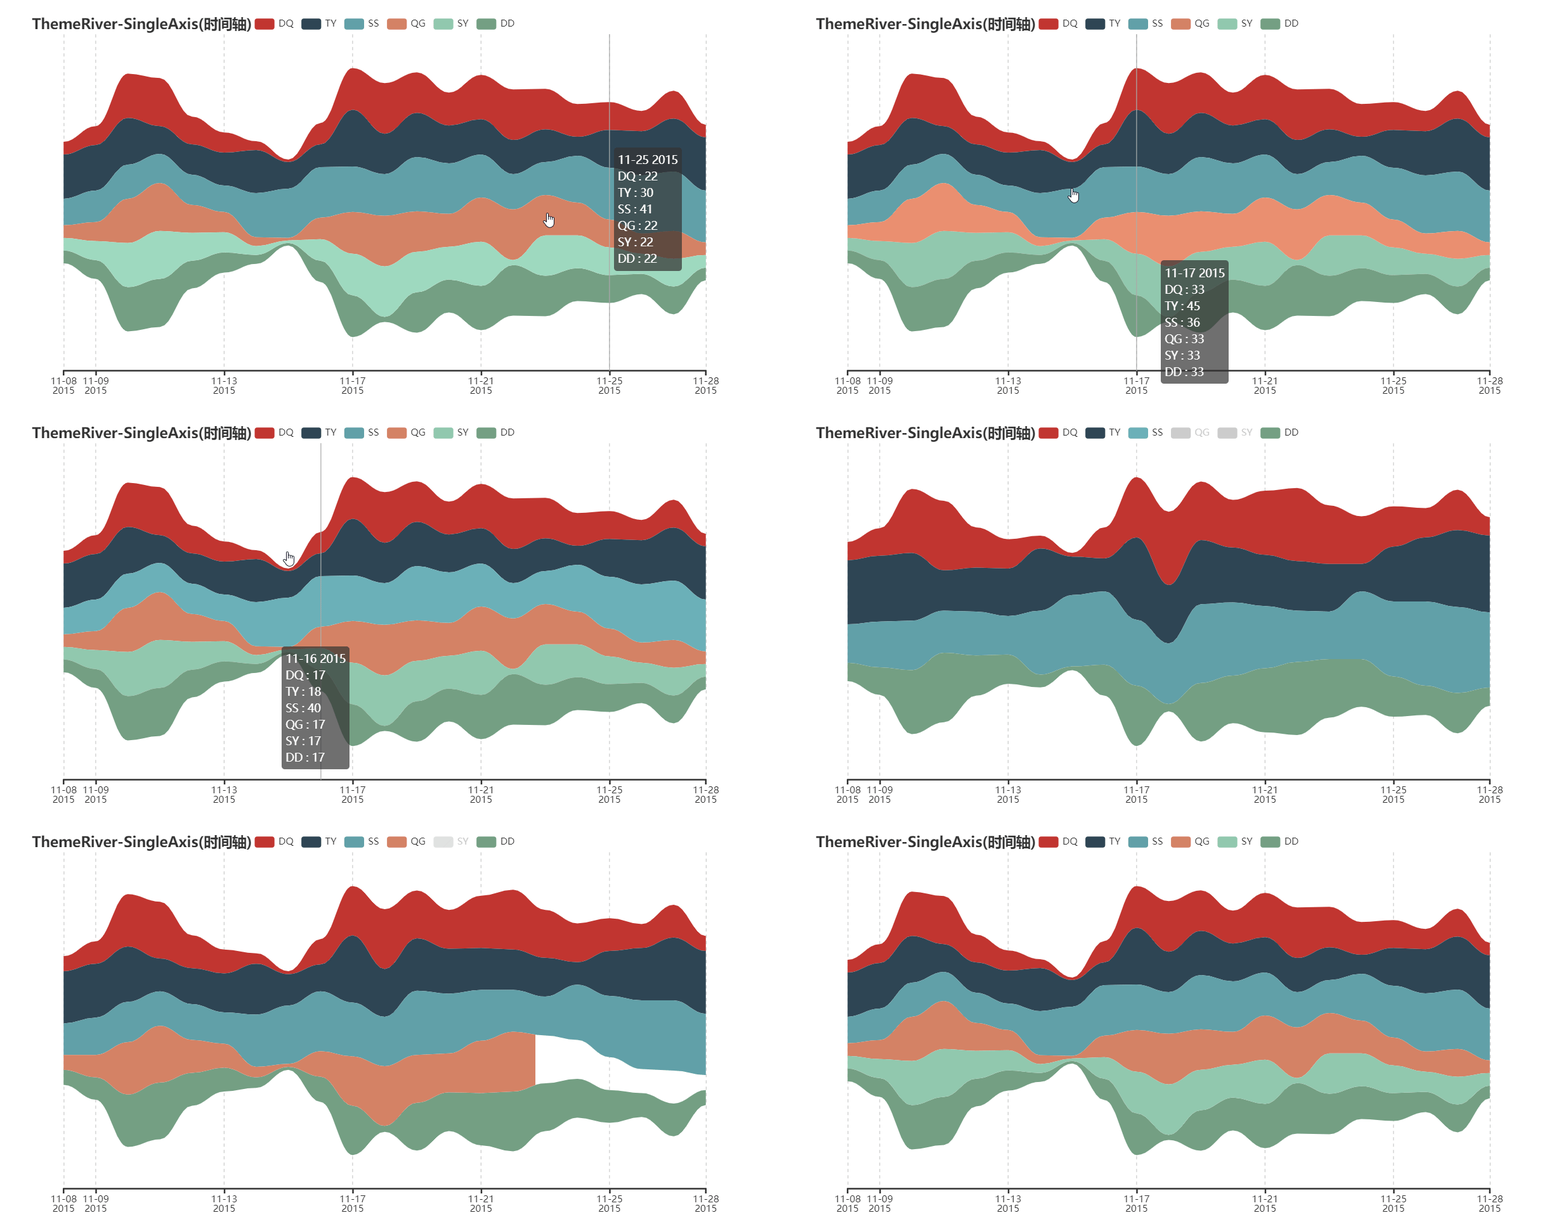
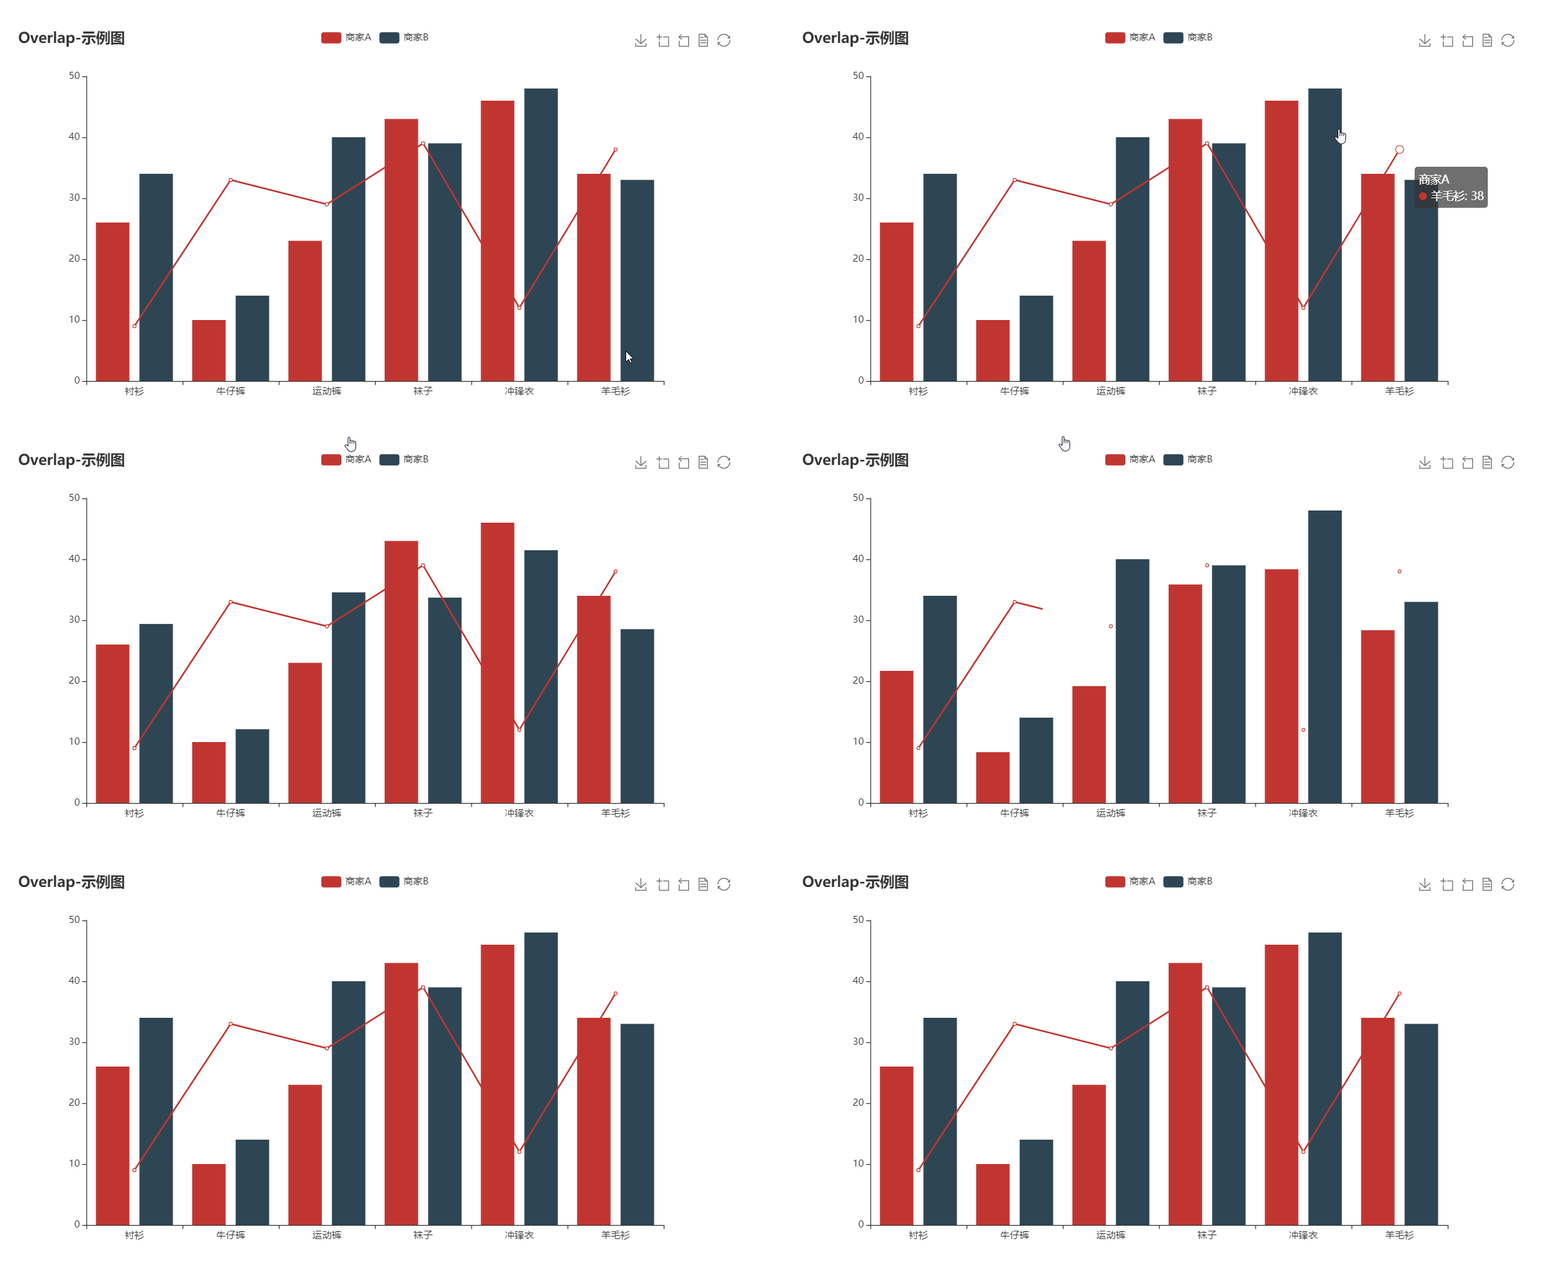
option
String
( required )
ECharts is mainly configured by passing a string value to the JavaScript option property.
You can use jsonEncode() function in dart:convert to convert data in Dart object form:
source: ${jsonEncode(_data1)},
Because JavaScript don't have ''', you can use this operator to reduce some escape operators for quotas:
Echarts(
  option: '''

    // option string

  ''',
),
To use images in option properties, we suggest the Base64 Data URL :
image: 'data:image/png;base64,iVBORw0KG...',
extraScript
String
JavaScript which will execute after the Echarts.init() and before any chart.setOption(). The widget has a Javascript channel named Messager, so you can use this identifier to send messages from JavaScript to Flutter:
extraScript: '''
  chart.on('click', (params) => {
    if(params.componentType === 'series') {
        Messager.postMessage('anything');
    }
  });
''',
onMessage
void Function(String)?
Function to handle the message sent by Messager.postMessage() in extraScript .
extensions
List<String>
List of strings are from Echarts extensions, such as themes, components, WebGL, and languages. You can download them from the official ECharts extension list. Insert extensions as raw strings:
const liquidPlugin = r'''

  // copy from liquid.min.js

''';
theme
String
You can download built-in ECharts themes or build your own custom themes with the ECharts theme builder. Copy the theme script into the extensions param and register the theme name with this param.
captureAllGestures
bool
( default: false )
Setting captureAllGestures to true is useful when handling 3D rotation and data zoom bars. Note that setting prevents containers like ListViews from reacting to gestures on the charts.
If true, captureHorizontalGestures and captureVerticalGestures are forced true.
captureHorizontalGestures
bool
( default: false )
Only capture horizontal gestures.
captureVerticalGestures
bool
( default: false )
Only capture vertical gestures.
onLoad
void Function(WebViewController)?
The callback when first time the chart is loaded and rendered. You can get the webview controller from this function to do your magic.
reloadAfterInit
bool
( default: false )
If you have trouble in rendering charts in "Movable Widgets"(ListView, SliverView, PageVIew...) on iOS, try setting reloadAfterInit to true .
onWebResourceError
void Function(WebViewController, Exception)?
Handle the web resource error.
Reactive Echarts Flutter Widget
A performance optimization of Flutter WebView
If you have any suggestions or requests, please open an issue.
The gallery GIF is from chenjiandongx
依賴清單 3 項
{"sdk":"flutter"}^4.2.4{"sdk":"flutter"}先依使用情境篩選,再比較專案活躍情況,最後到原始儲存庫確認使用要求。
“A repository is the most basic element of GitHub.”
GitHub Docs — About repositories ↗