
 v1.5.0
logarte
功能強大的 Flutter 應用內調試控制台,具備網路檢查器、儲存監控和密碼保護功能
249喜歡 6010近 30 天下載120Pub 分數
AndroidiOSWebmacOSWindowsLinux
🪵 適用於 Flutter 的應用內除錯控制台和記錄器

>=4.0.0 <6.0.0{"sdk":"flutter"}{"sdk":"flutter"}^2.0.0以下為英文專案原文快照,最新內容請造訪 GitHub。
In-app debug console and logger for Flutter apps.
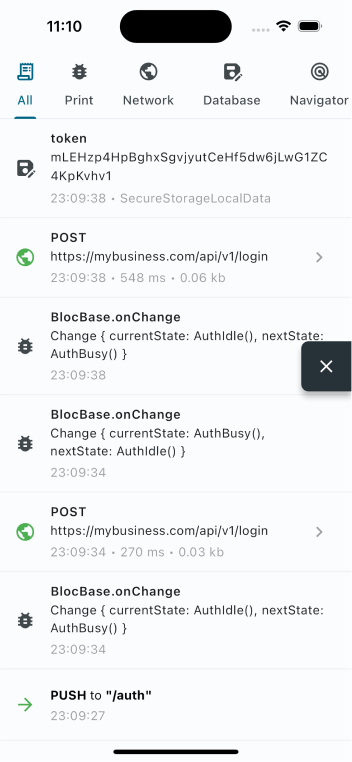
| Console | API Request | Password |
|---|---|---|
| https://github.com/kamranbekirovyz/logarte/blob/main/res/s1.png?raw=true | https://github.com/kamranbekirovyz/logarte/blob/main/res/s2.png?raw=true | https://github.com/kamranbekirovyz/logarte/blob/main/res/s3.png?raw=true |
Want to say "thanks"? Check out our sponsors:
https://www.userorient.com/assets/extras/sponsor.pngdependencies:
logarte: ^0.2.1
Then run flutter pub get.
Create a global Logarte instance:
final Logarte logarte = Logarte(
    // Protect with password
    password: '1234',

    // Skip password in debug mode
    ignorePassword: kDebugMode,

    // Share network request
    onShare: (String content) {
      Share.share(content);
    },

    // To have logs in IDE's debug console (default is false)
    disableDebugConsoleLogs: false,

    // Add shortcut actions (optional)
    onRocketLongPressed: (context) {
      // e.g: toggle theme mode
    }
    onRocketDoubleTapped: (context) {
      // e.g: change language
    }
);
Ideally, you should attach the floating button to the widget tree, then click it to open the debug console. This is the preferred way because you don't know when you'll need it and sometimes you might need to go back and forth many times. So, it's better to have it on the UI always.
@override
void initState() {
  super.initState();

  logarte.attach(
    context: context,
    visible: kDebugMode,
  );
}
This will attach the floating button when in debug mode. Curious how you can access it in production when it's not debug mode? Check below.
Logarte is as valuable in production mode as it is in debug mode. Whenever you find a bug, notice something not working, API requests failing, etc., you should be able to check the console and find why.
Two ways to access in production:
LogarteMagicalTap is a widget that attaches the floating button to the UI when tapped 10 times. Wrap any non-tappable widget, keep it secret, and make sure you've set a password while initializing.
LogarteMagicalTap(
  logarte: logarte,
  child: Text('App Version 1.0'),
)
You might also have creative ideas on when and how to open the console. For example, I used a shake detection plugin and attached the floating button when the device was shaken 3 times consecutively. From my experience, this is extremely valuable. Why? Imagine: you've opened your app, went to deeper screens, and an API call failed. You say 'Thank God I've already integrated logarte. Let's open that console!' But you need to go to the page where you used LogarteMagicalTap, which might be too far or not visible at that stage of the app - maybe you're showing it on the profile page and you are on the login page. So be creative about where to add it and consider using shake detection or anything that would serve you better.
logarte.openConsole(context);
Different from the .attach(context) method, this will directly open the console (password page if set, else the console itself).
dio.interceptors.add(LogarteDioInterceptor(logarte));
That's it? Yes, that's it. Now, all the network requests will be logged in both the debug and the graphical console.
// After your HTTP request:
logarte.network(
  request: NetworkRequestLogarteEntry(
    method: 'POST',
    url: endpoint,
    headers: headers,
    body: body,
  ),
  response: NetworkResponseLogarteEntry(
    statusCode: response.statusCode,
    headers: response.headers,
    body: response.body,
  ),
);
logarte.log('Button clicked');
This will log messages in both your IDE's debug console and the in-app logarte console.
MaterialApp(
  navigatorObservers: [LogarteNavigatorObserver(logarte)],
)
logarte.database(
  target: 'language',
  value: 'en',
  source: 'SharedPreferences',
);
While initializing, you can pass a custom tab widget to the Logarte instance. This tab will be shown in the console.
This is useful when you want to add a custom tab to the console, for example, to change the environment, copy device's FCM token, clear local cache, etc.
final Logarte logarte = Logarte(
  ...
  customTab: const MyCustomTab(),
  ...
);
See the complete example in this repository.
MIT License - see LICENSE.