

 v1.1.0+2
stacked_bar_chart
一個 Flutter 庫,用於繪製可滾動且可根據開發者需求自訂的圖表。
38喜歡 16近 30 天下載130Pub 分數
AndroidiOSWebmacOSWindowsLinux
sandeshgyw/stacked_bar_graph open-source repository details.

以下為英文專案原文快照,最新內容請造訪 GitHub。
A Flutter package for creating different types of charts.This package gives developer the flexibility to customize their graph as well.

Plot graphs
Customize your graph
Scrollable
Provide data in json format
Style your Labels
Callback on bar tap
In the dependencies: section of your pubspec.yaml, add the following line:
stacked_bar_chart:
Then import it as :
import 'package:stacked_bar_chart/stacked_bar_chart.dart';
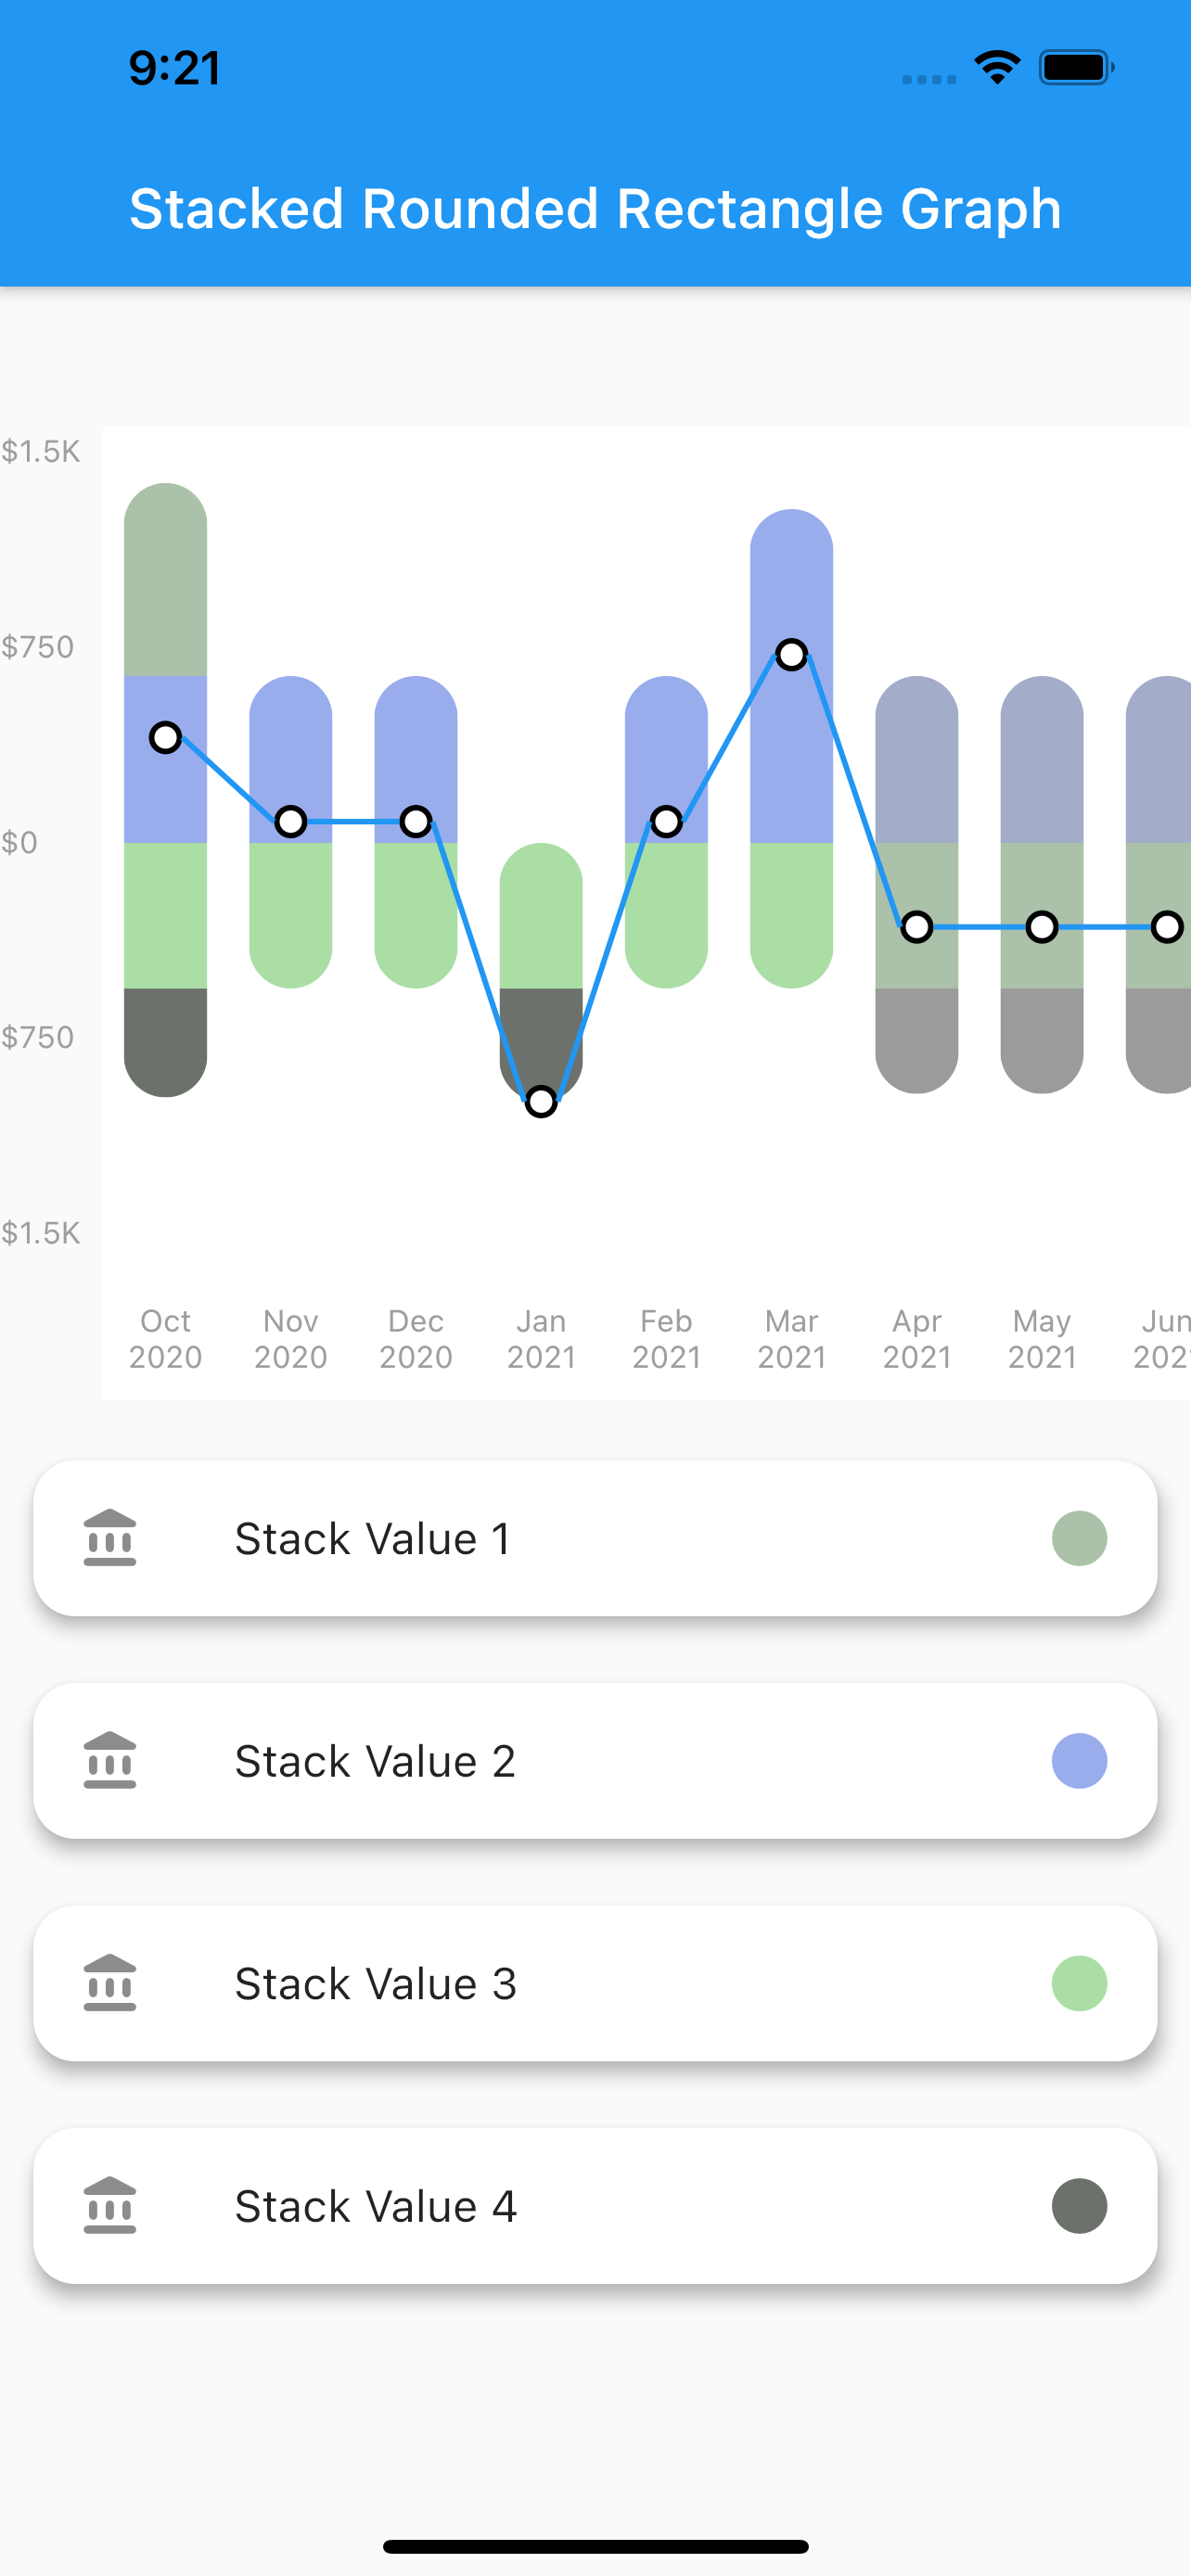
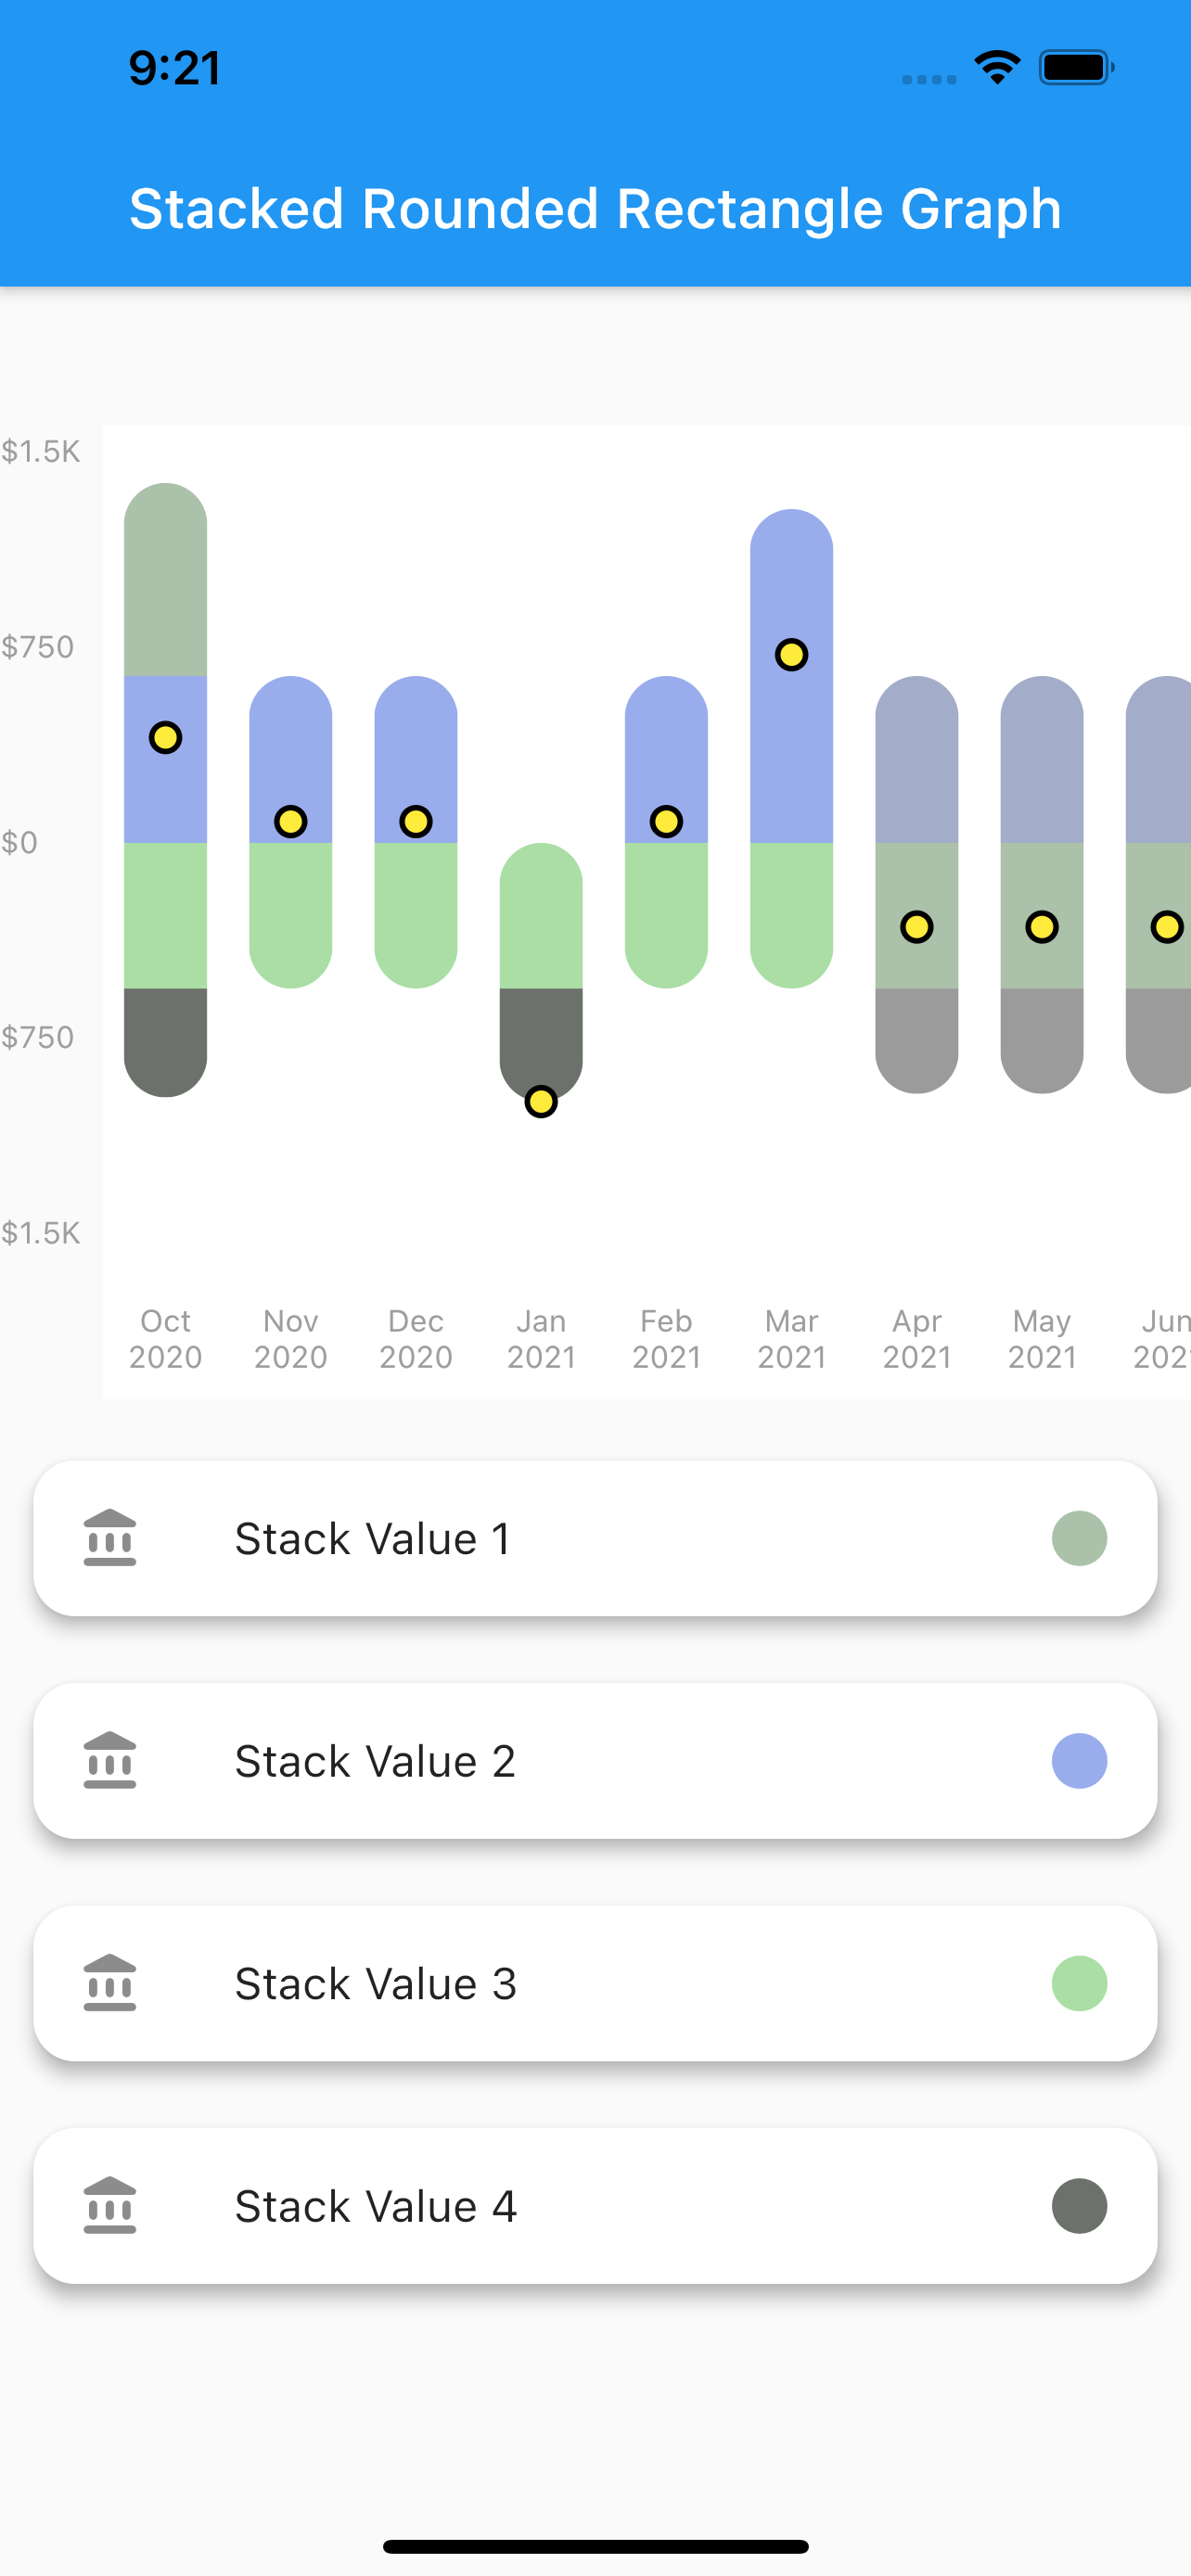
GraphType.StackedRounded in graphType. as shown belowgraphType: GraphType.StackedRounded
You can also change the styling of the line and point plotted.The color,width etc. can be changed using the netLine parameter as :
netLine: NetLine(
                showPointOnly: false,
                showLine: true,
                lineColor: Colors.blue,
                pointBorderColor: Colors.black,
                coreColor: Colors.white,
              ),

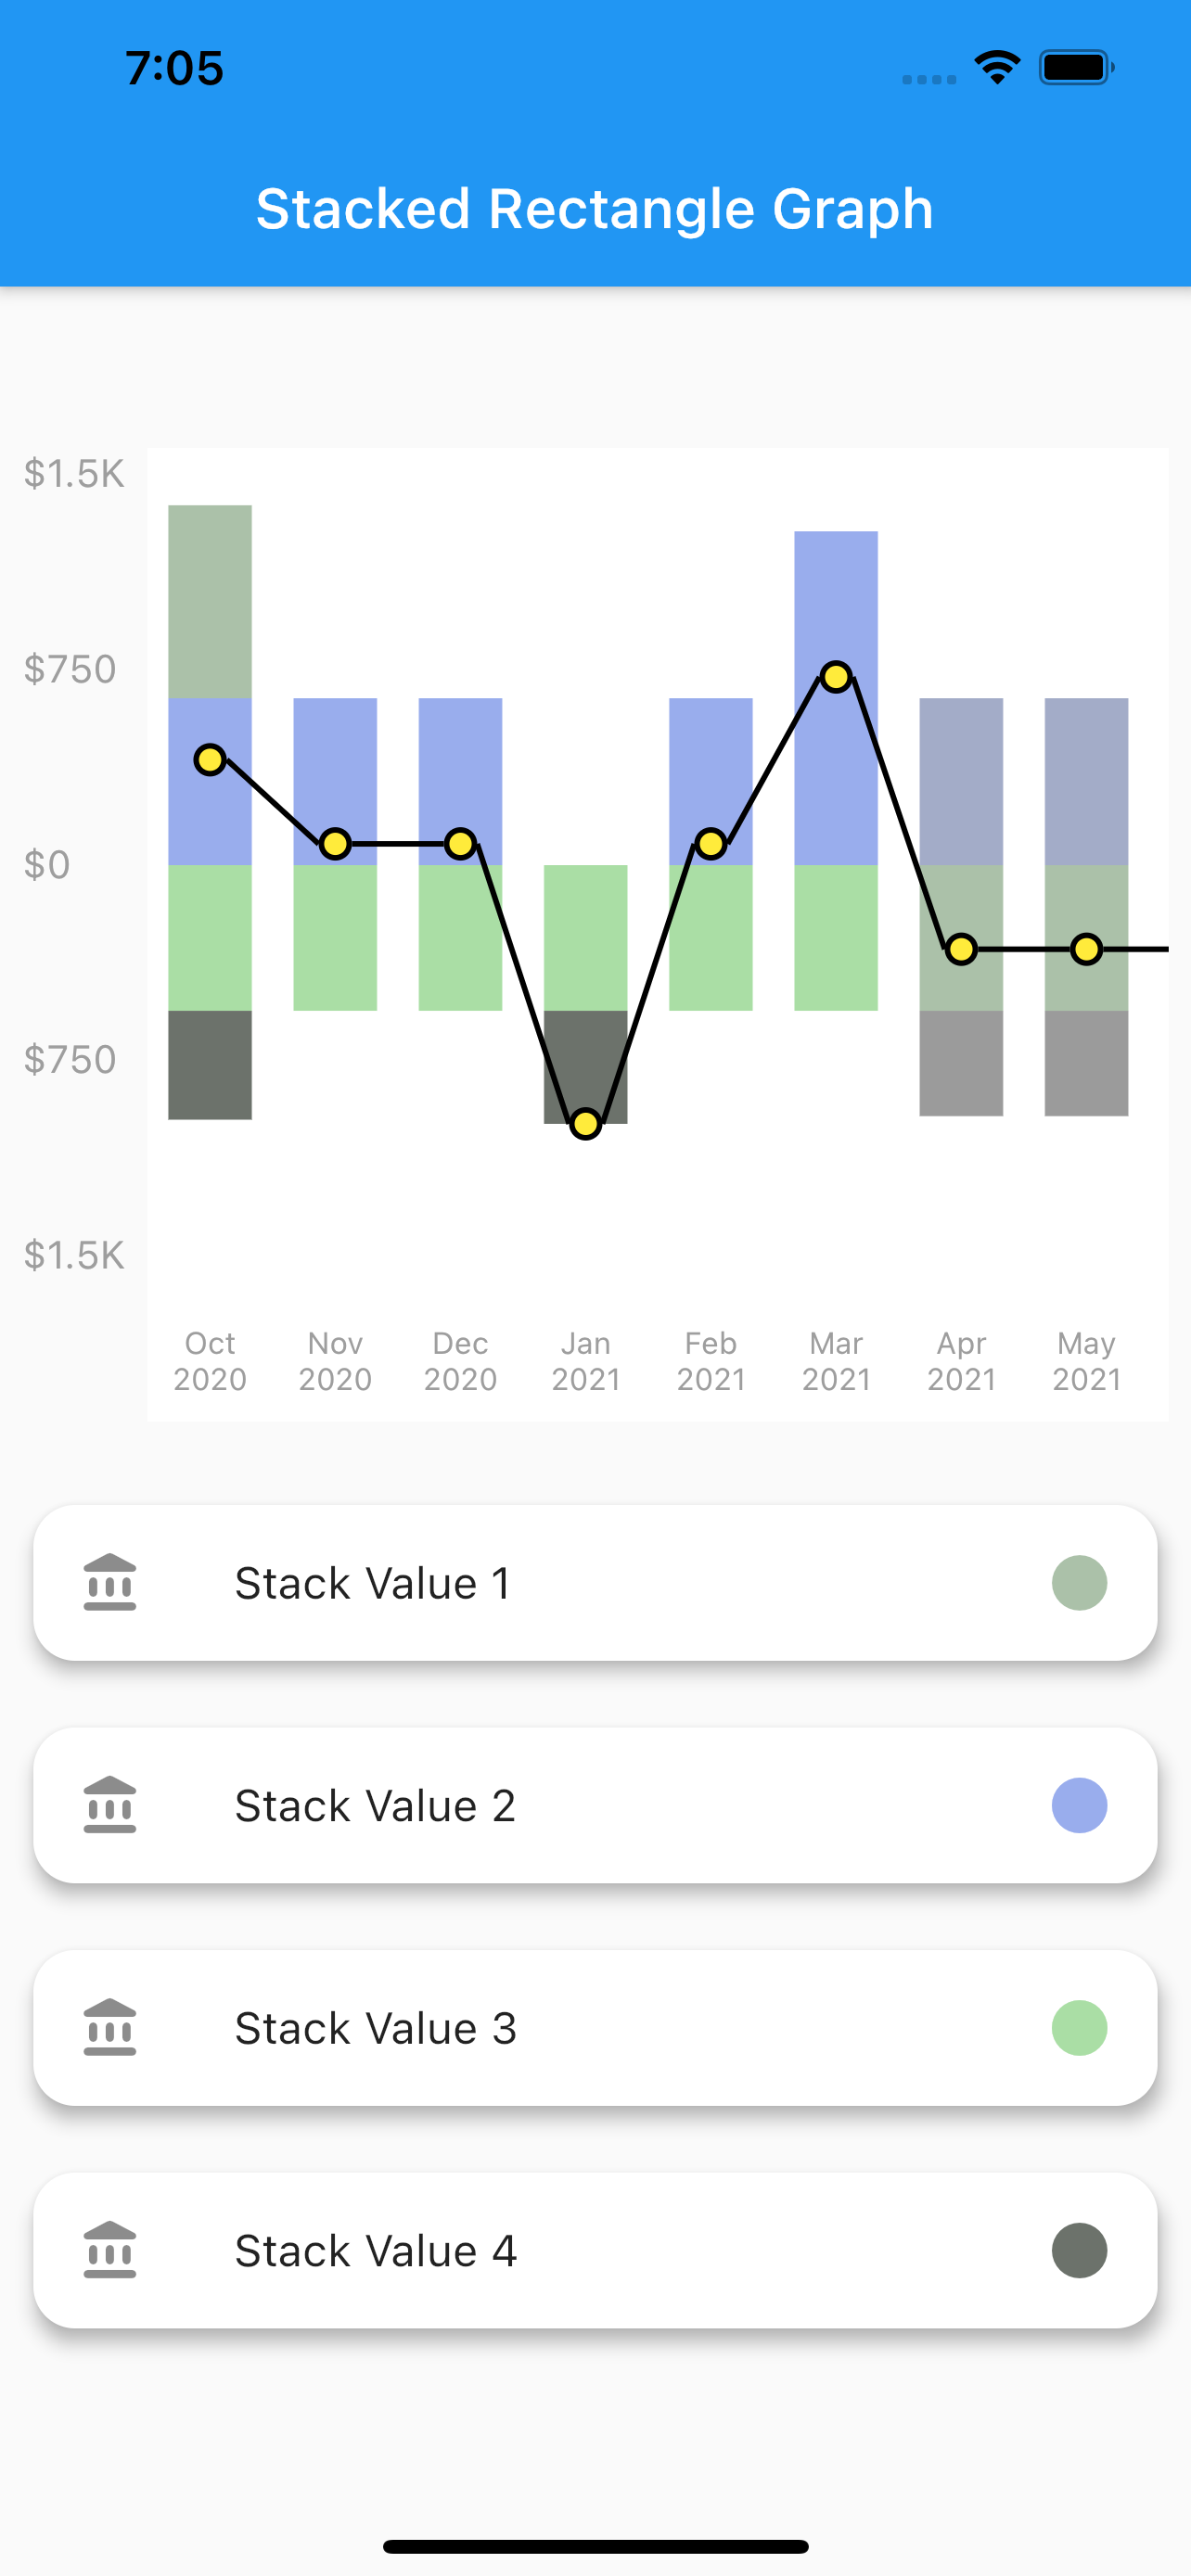
A simple stacked bar graph with no rounded borders. You can customize it in the same way as the stacked rounded rectangle graph.
To plot this graph pass the GraphType.StackedRect in graphType. as shown below
graphType: GraphType.StackedRect
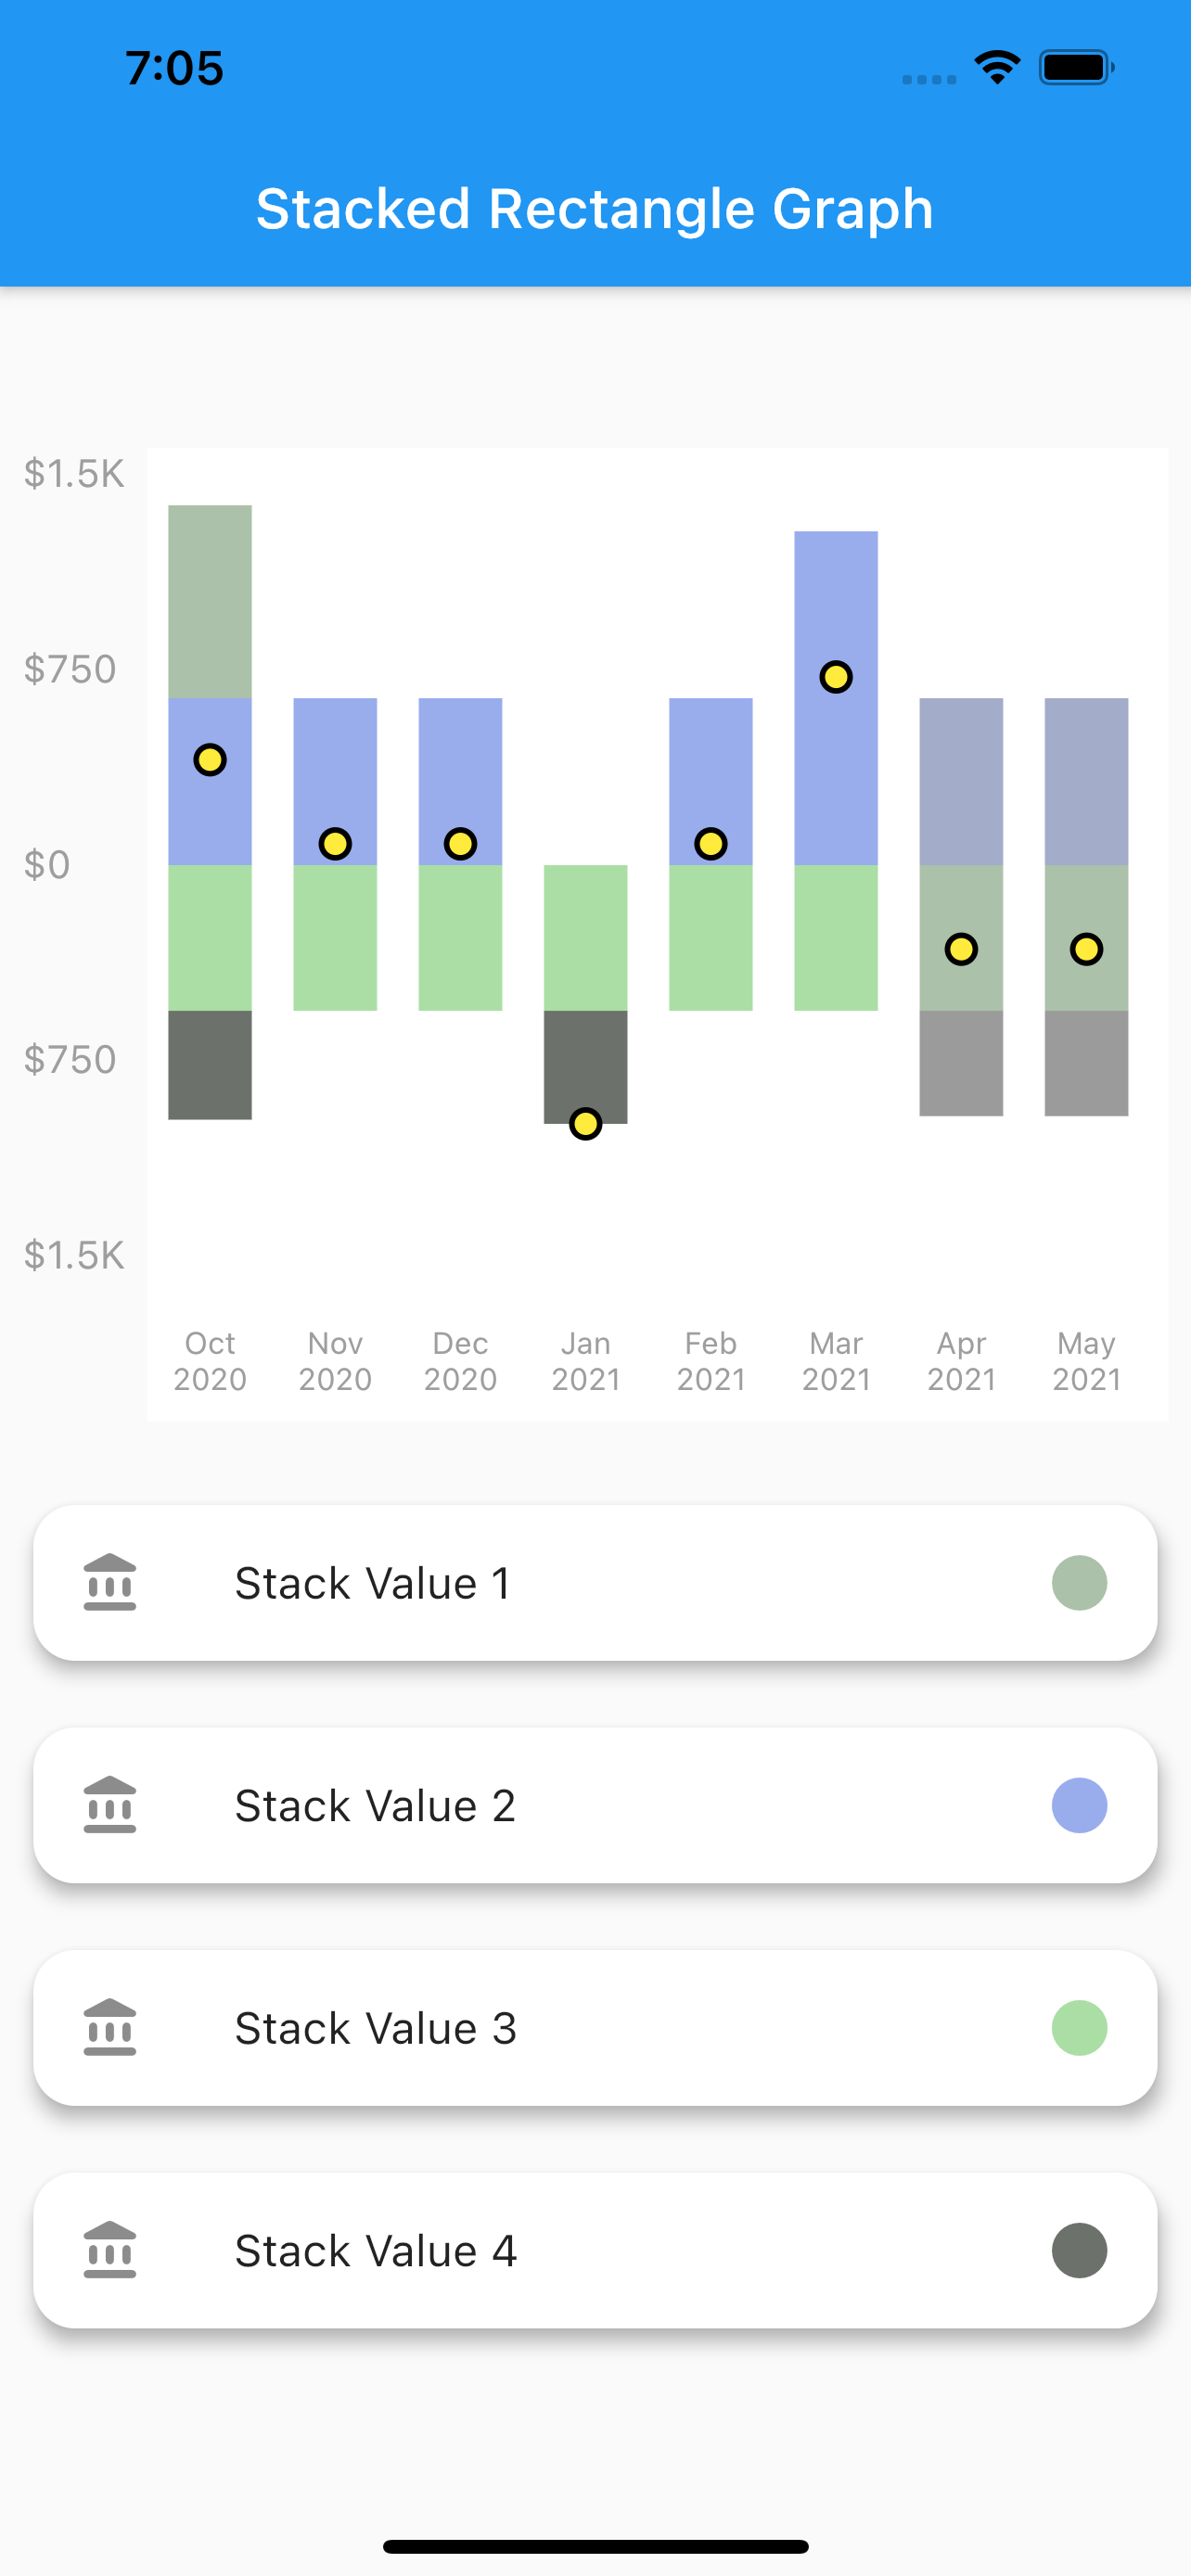

A simple line graph plotted with the net values of the data provided. The net values of a particular data is calculated and plotted.It can also be customized in the same way as stacked rounded rectangle graph.
To plot this graph pass the GraphType.StackedRect in graphType. as shown below
graphType: GraphType.LineGraph

A simple plot of the net values of the data.You can customize the point core and it's outer border using the netPoint parameter.
To plot this graph pass the GraphType.StackedRect in graphType. and then pass parameters in netLine to remove the line as shown below
graphType: GraphType.LineGraph
netLine: NetLine(
                showPointOnly: true,
                showLine: false,
                lineColor: Colors.blue,
                pointBorderColor: Colors.black,
                coreColor: Colors.white,
              ),

class StackedBarGraph extends StatefulWidget {
  StackedBarGraph({Key key}) : super(key: key);

  @override
  _StackedBarGraphState createState() => _StackedBarGraphState();
}

class _StackedBarGraphState extends State<StackedBarGraph> {
  @override
  Widget build(BuildContext context) {
    return Scaffold(
      appBar: AppBar(
        title: Text("Stacked Rounded Rectangle Graph"),
      ),
      body: Column(
        children: [
          SizedBox(
            height: 50,
          ),
          Graph(
            yLabelConfiguration: YLabelConfiguration(
              yLabelStyle: TextStyle(
                color: Colors.grey,
                fontSize: 11,
              ),
              interval: 500,
              labelCount: 5,
              yLabelMapper: (num value) {
                return NumberFormat.compactCurrency(
                        locale: "en", decimalDigits: 0, symbol: "\$")
                    .format(value);
              },
            ),
            xLabelConfiguration: XLabelConfiguration(
              xLabelStyle: TextStyle(
                color: Colors.grey,
                fontSize: 11,
              ),
              xLabelMapper: (DateTime date) {
                return DateFormat("MMM yyyy").format(date);
              },
            ),
            netLine: NetLine(
              showLine: true,
              lineColor: Colors.black,
              pointBorderColor: Colors.black,
              coreColor: Colors.yellow,
            ),
            graphType: GraphType.StackedRounded,
            data: GraphData(
              backgroundColor: Colors.white,
              name: "ThePension",
              bars: [
                GraphBar(
                  month: DateTime(2020, 01),
                  sections: [
                    GraphBarSection(value: 200, color: Colors.pink),
                    GraphBarSection(value: 900, color: Colors.blue),
                    GraphBarSection(value: -200, color: Colors.amber),
                    GraphBarSection(value: -700, color: Colors.purple),
                  ],
                ),
                GraphBar(
                  month: DateTime(2020, 2),
                  sections: [
                    GraphBarSection(value: 300, color: Colors.pink),
                    GraphBarSection(value: 700, color: Colors.blue),
                    GraphBarSection(value: -400, color: Colors.amber),
                    GraphBarSection(value: -600, color: Colors.purple),
                  ],
                ),
                GraphBar(
                  month: DateTime(2020, 3),
                  sections: [
                    GraphBarSection(value: 400, color: Colors.pink),
                    GraphBarSection(value: 700, color: Colors.blue),
                    GraphBarSection(value: -100, color: Colors.amber),
                    GraphBarSection(value: -900, color: Colors.purple),
                  ],
                ),
                GraphBar(
                  month: DateTime(2020, 4),
                  sections: [
                    GraphBarSection(value: 400, color: Colors.pink),
                    GraphBarSection(value: 0, color: Colors.blue),
                    GraphBarSection(value: -800, color: Colors.amber),
                    GraphBarSection(value: -400, color: Colors.purple),
                  ],
                ),
                GraphBar(
                  month: DateTime(2020, 5),
                  sections: [
                    GraphBarSection(value: 700, color: Colors.pink),
                    GraphBarSection(value: 900, color: Colors.blue),
                    GraphBarSection(value: -200, color: Colors.amber),
                    GraphBarSection(value: -100, color: Colors.purple),
                  ],
                ),
                GraphBar(
                  month: DateTime(2020, 6),
                  sections: [
                    GraphBarSection(value: 900, color: Colors.pink),
                    GraphBarSection(value: 900, color: Colors.blue),
                    GraphBarSection(value: -200, color: Colors.amber),
                    GraphBarSection(value: -100, color: Colors.purple),
                  ],
                ),
                GraphBar(
                  month: DateTime(2020, 7),
                  sections: [
                    GraphBarSection(value: 300, color: Colors.pink),
                    GraphBarSection(value: 800, color: Colors.blue),
                    GraphBarSection(value: -200, color: Colors.amber),
                    GraphBarSection(value: -1100, color: Colors.purple),
                  ],
                ),
                GraphBar(
                  month: DateTime(2020, 8),
                  sections: [
                    GraphBarSection(value: 250, color: Colors.pink),
                    GraphBarSection(value: 980, color: Colors.blue),
                    GraphBarSection(value: -210, color: Colors.amber),
                    GraphBarSection(value: -720, color: Colors.purple),
                  ],
                ),
                GraphBar(
                  month: DateTime(2020, 9),
                  sections: [
                    GraphBarSection(value: 300, color: Colors.pink),
                    GraphBarSection(value: 200, color: Colors.blue),
                    GraphBarSection(value: -200, color: Colors.amber),
                    GraphBarSection(value: -400, color: Colors.purple),
                  ],
                ),
                GraphBar(
                  month: DateTime(2020, 10),
                  sections: [
                    GraphBarSection(value: 200, color: Colors.pink),
                    GraphBarSection(value: 900, color: Colors.blue),
                    GraphBarSection(value: -200, color: Colors.amber),
                    GraphBarSection(value: -700, color: Colors.purple),
                  ],
                ),
              ],
            ),
            onBarTapped: (GraphBar bar) {
              print(bar.month);
            },
          ),
        ],
      ),
    );
  }
}
依賴清單 4 項
{"sdk":"flutter"}^1.15.0^0.17.0{"sdk":"flutter"}先依使用情境篩選,再比較專案活躍情況,最後到原始儲存庫確認使用要求。
“A repository is the most basic element of GitHub.”
GitHub Docs — About repositories ↗