
 v1.1.11
line_chart
A simple flutter package to create a custom line chart
28Likes 10230-day downloads140Pub points
AndroidiOSWebmacOSWindowsLinux
A simple flutter package to create a custom line chart

^1.0.6{"sdk":"flutter"}{"sdk":"flutter"}English project snapshot. Visit GitHub for the latest content.
A simple flutter package to create a custom line chart
LineChart
Add line_chart: ^1.0.9 in your pubspec.yaml dependencies. And import it:
import 'package:line_chart/charts/line-chart.widget.dart';
Simply create a LineChart widget and pass the required params:
LineChart(
  width: 300, // Width size of chart
  height: 180, // Height size of chart
  data: [], // The value to the chart
  linePaint: Paint()
      ..strokeWidth = 3
      ..style = PaintingStyle.stroke
      ..color = Colors.black, // Custom paint for the line
),
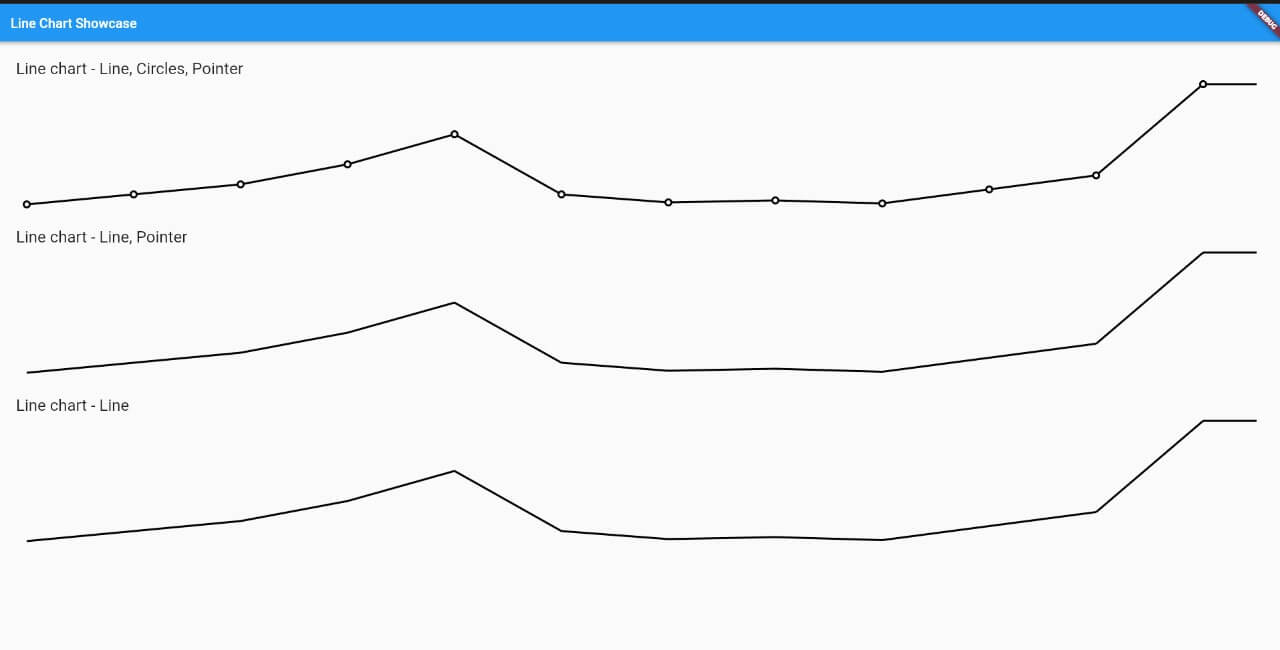
Here is the widget with all options for use.
LineChart(
  width: 300, // Width size of chart
  height: 180, // Height size of chart
  data: [], // The value to the chart
  linePaint: Paint()
      ..strokeWidth = 3
      ..style = PaintingStyle.stroke
      ..color = Colors.black, // Custom paint for the line
  circlePaint: Paint()..color = Colors.black, // Custom paint for the line
  showPointer: true, // When press or pan update the chart, create a pointer in approximated value (The default is true)
  showCircles: true, // Show the circle in every value of chart
  customDraw: (Canvas canvas, Size size) {}, // You can draw anything in your chart, this callback is called when is generating the chart
  circleRadiusValue: 6, // The radius value of circle
  linePointerDecoration: BoxDecoration(
    color: Colors.black,
  ) // Your line pointer decoration,
  pointerDecoration: BoxDecoration(
    shape: BoxShape.circle,
    color: Colors.black,
  ) // Your decoration of circle pointer,
  insideCirclePaint: Paint()..color = Colors.white // On your circle of the chart, have a second circle, which is inside and a slightly smaller size.
  onValuePointer: (MonthChartModel value) {
    print('onValuePointer');
  } // This callback is called when change the pointer,
  onDropPointer: () {
    print('onDropPointer');
  }, // This callback is called when it is on the pointer and removes your finger from the screen
),
For a more detail example please take a look at the example folder.
If something is missing, feel free to open a ticket or contribute!