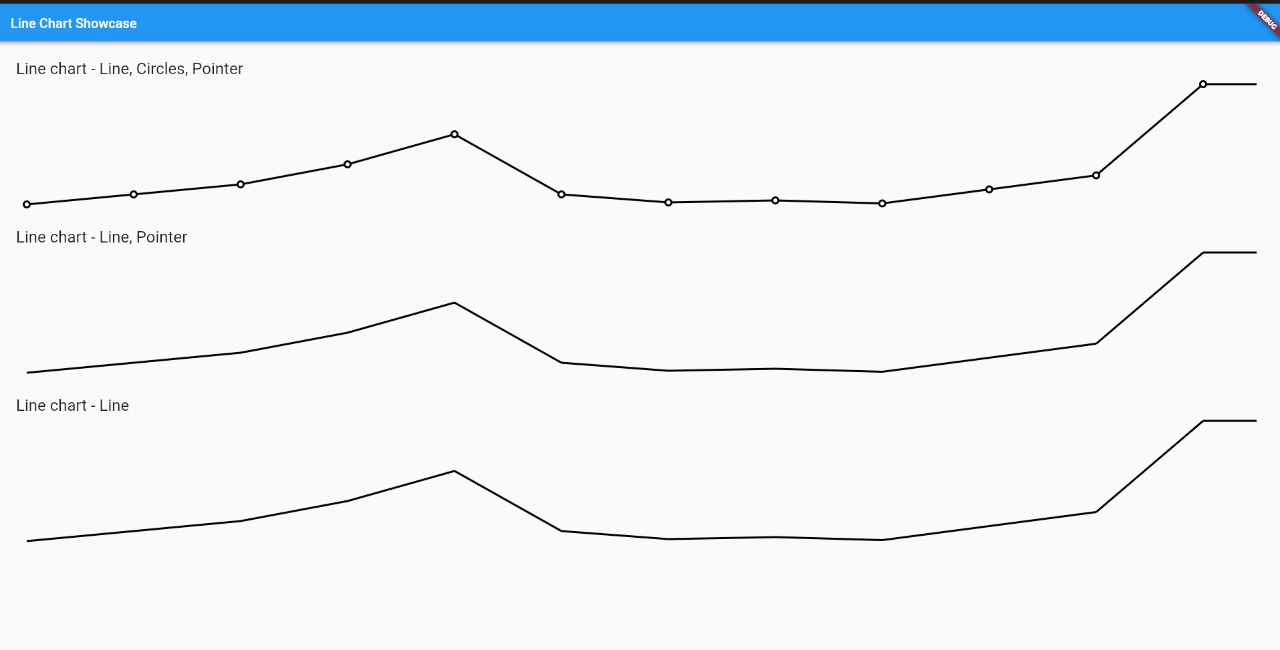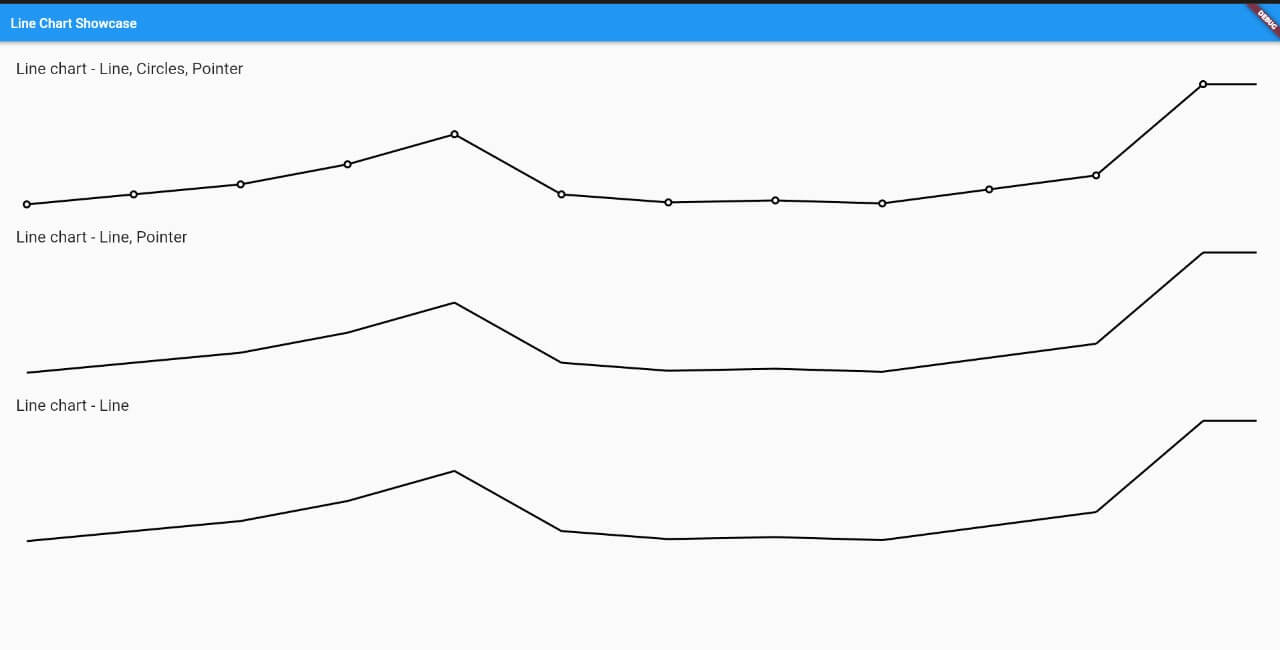
A simple Flutter package for creating customizable line charts. It enables developers to visualize data trends with smooth, interactive lines across multiple platforms including Android, iOS, Web, macOS, Windows, and Linux. The package focuses on ease of use and flexibility, allowing customization of colors, labels, gridlines, and chart behavior. Ideal for apps requiring real-time or historical data representation in a clean, intuitive format.
Use cases
- Displaying time-series data
- Visualizing performance metrics
- Tracking user activity over time
- Presenting financial or sales trends
- Creating dashboards with dynamic charts
Key features
- Customizable line colors and styles
- Support for multiple data series
- Interactive touch events
- Configurable axis labels and gridlines
- Responsive design across devices
Suitable for
- Data-driven applications
- Analytics dashboards
- Mobile and web apps with visualizations
- Educational tools with graphs
- Prototyping chart interfaces
Considerations
- Limited to line-based visualizations
- No built-in tooltips or legends
- Requires manual handling of complex data formatting
- Not optimized for large datasets
- Depends on external dependencies for advanced features