Plots & Visualization
Top Flutter Plots and Visualization packages Charts and plots are visual representations of data. They can be used to show trends, patterns, and relationships between different variables. Different types of charts are better suited for different types of data. For example, a line chart is often used to show how a variable changes over time, while a bar chart is better suited for comparing different groups of data. The complete list of Flutter packages that can help you add Charts, Plots and Visualizations like line charts, bar charts, radial charts, pie charts, sparklines, speedometer, etc., in your Flutter app is provided below.


bezier_chart
248
A beautiful bezier line chart widget for flutter that is highly interactive and configurable.


high_chart
88
A chart library based on High Charts (.JS), able to build advanced charts like Pie chart, linear chart, etc.


draw_graph
70
Do you want to display a graph in your app? This package can help. It has a widget that draws line graph for you.


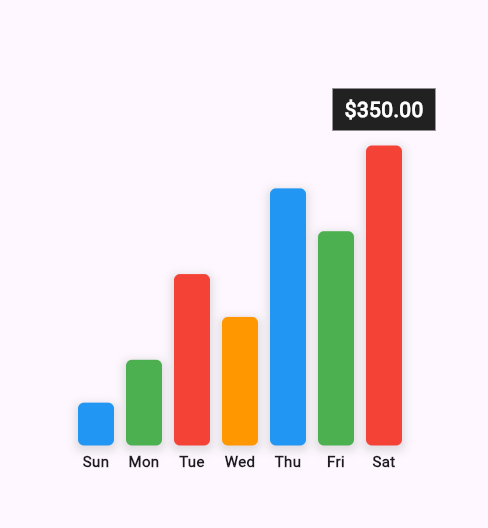
chart_components
49
Two chart components for Flutter. Animated bar chart and animated calendar grid chart based on the github's one. Many properties to customize.


flutter_annual_task
45
Flutter package for displaying grid view of daily task like Github-Contributions(Github calendar).


fcharts
37
A chart library for Flutter. Create beautiful, animated, responsive charts using a simple and intuitive API.
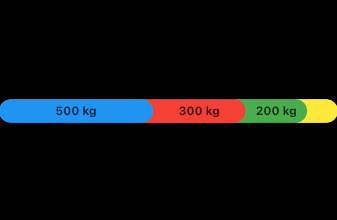
stacked_bar_chart
36
A flutter library to draw graphs that can be scrolled as well as customized per the developers need.


org_chart
33
A flutter orgranizational chart with drag and drop, zoom and pan, search, collapse, expand, and easy customizations!


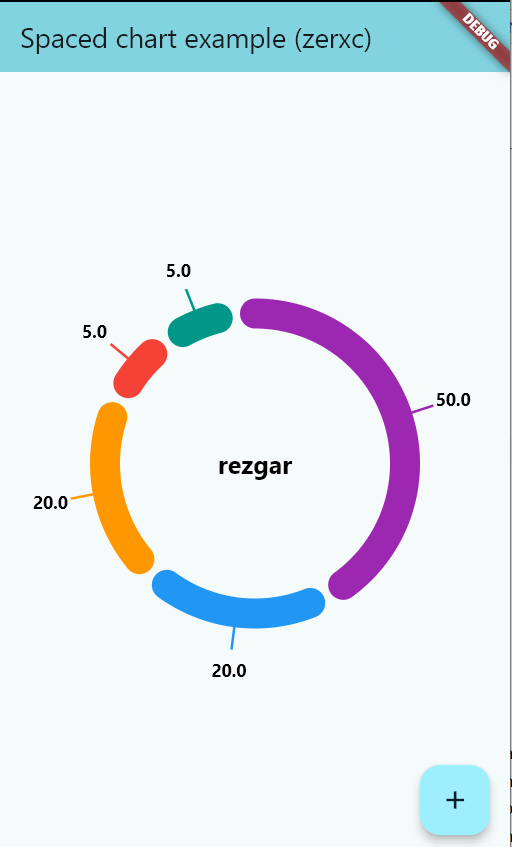
flutter_circle_chart
29
A Flutter package to create a Circle Chart with multiple drawing types. It will be useful for your awesome app.


sheet_music
24
A Flutter Widget for Sheet Music (All Major Flat and Sharp Scales, Notes from 5 below and 5 above the bar, Treble and Bass Clef).
pretty_gauge
21
Fully customizable Gauge widget for Flutter with options for multiple segments, colors and customizable styling for displaying current value and text
github_calendar
18
A calendar view like github repo contributions. It is a stateless widget, and help you to create a thermodynamic chart that show your users' activities.
customgauge
17
Fully customizable Gauge widget for Flutter with options for multiple segments, colors and customizable styling for displaying current value and text