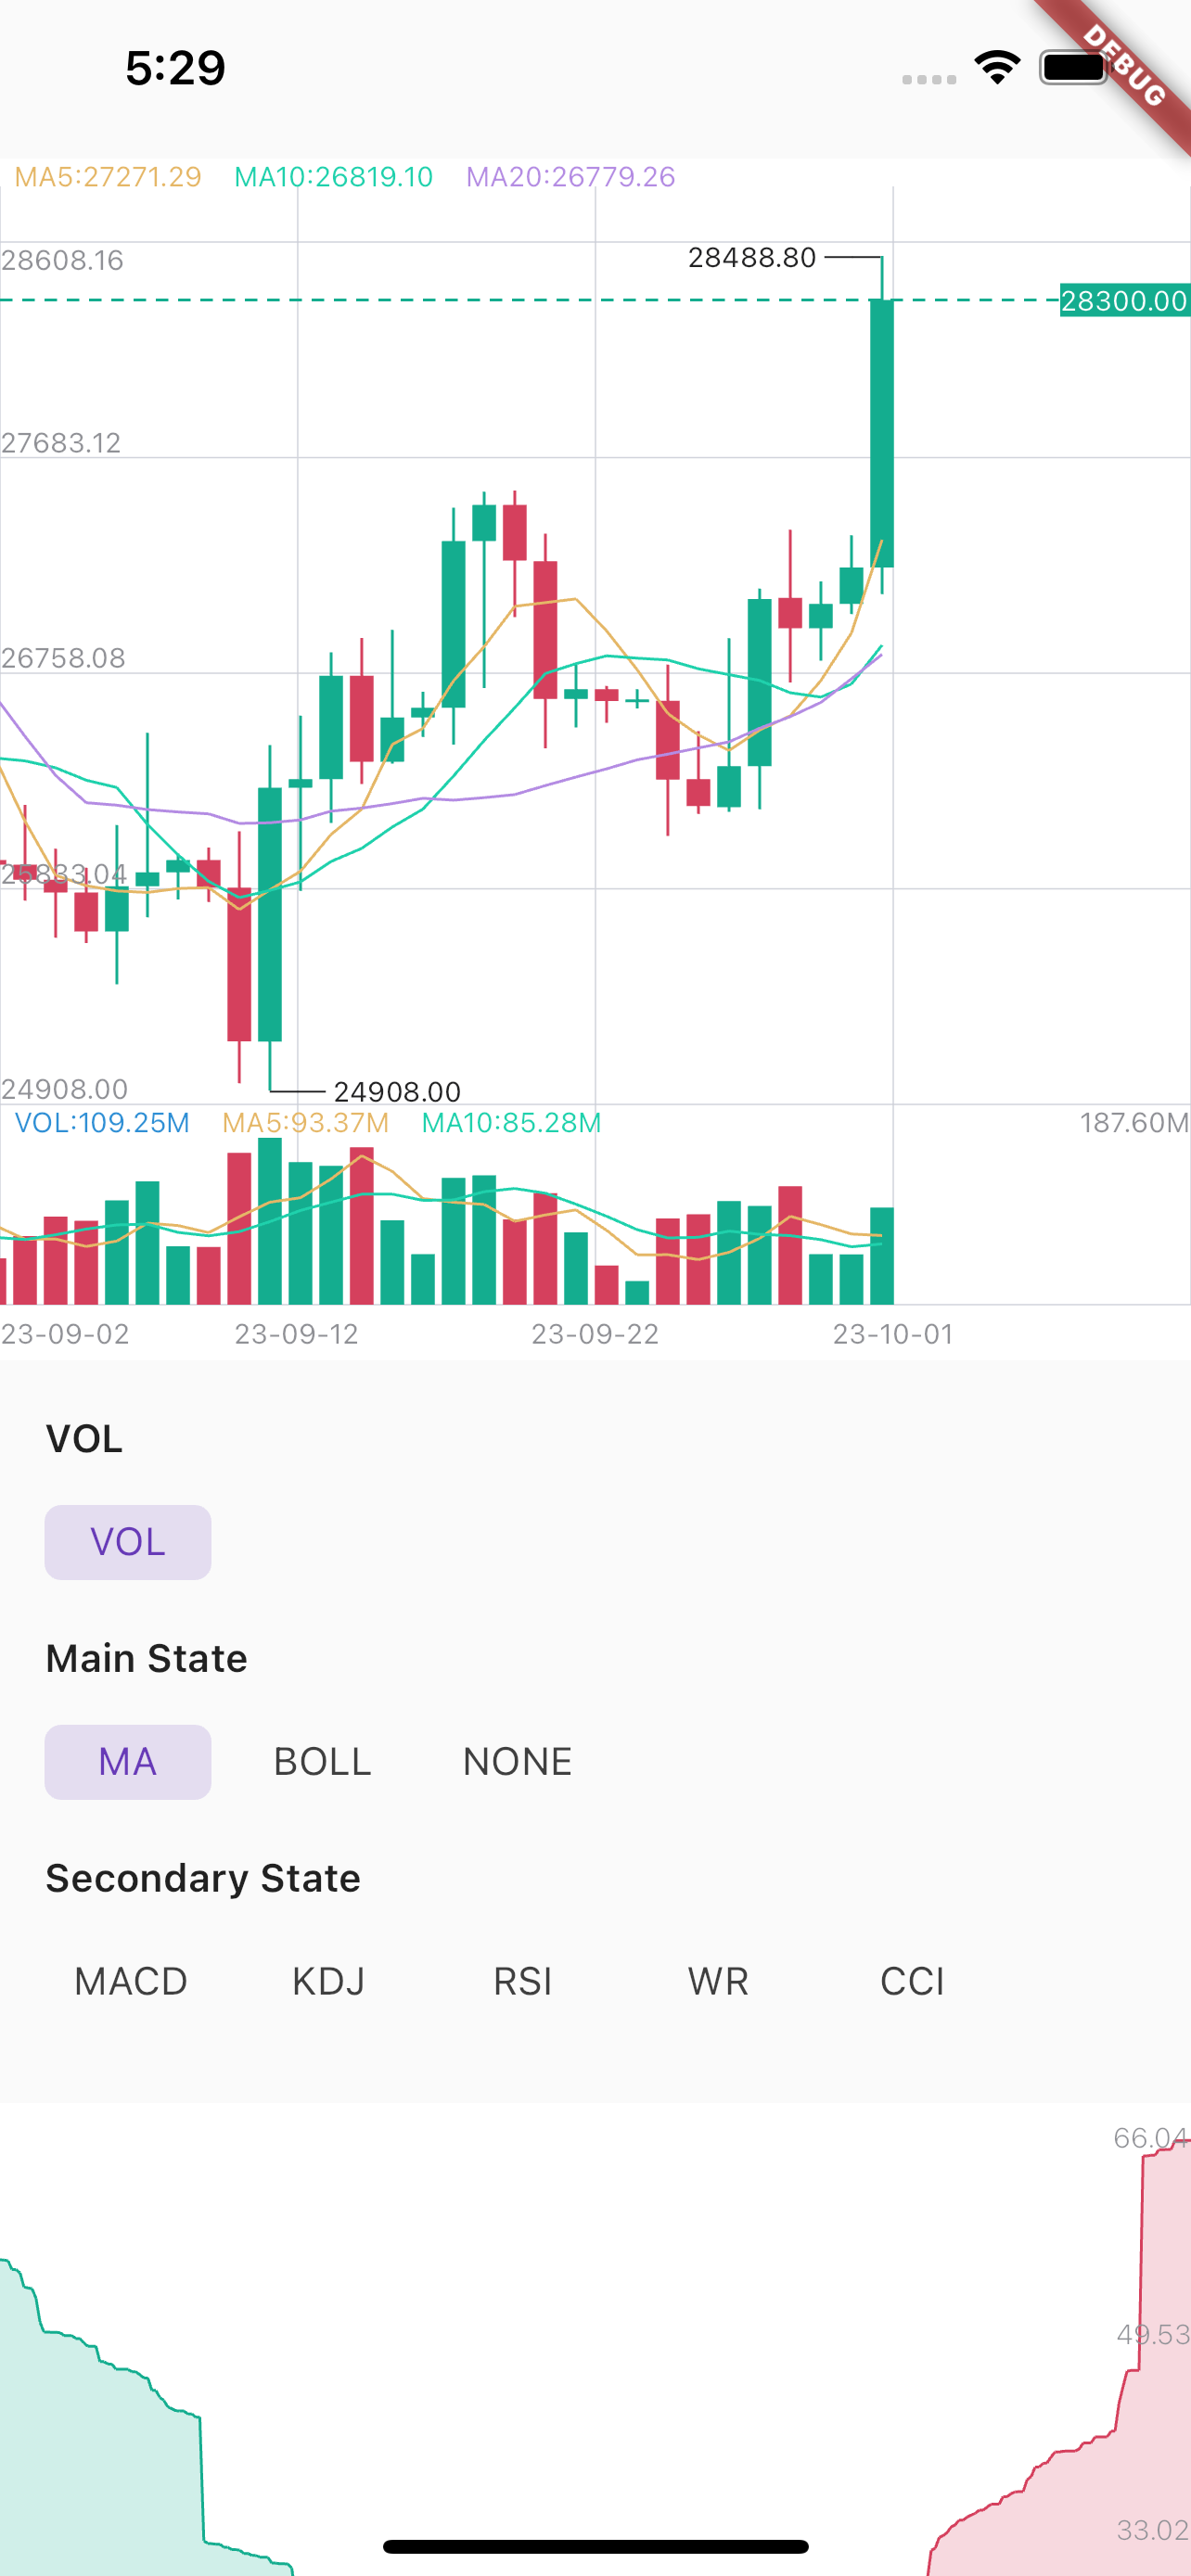
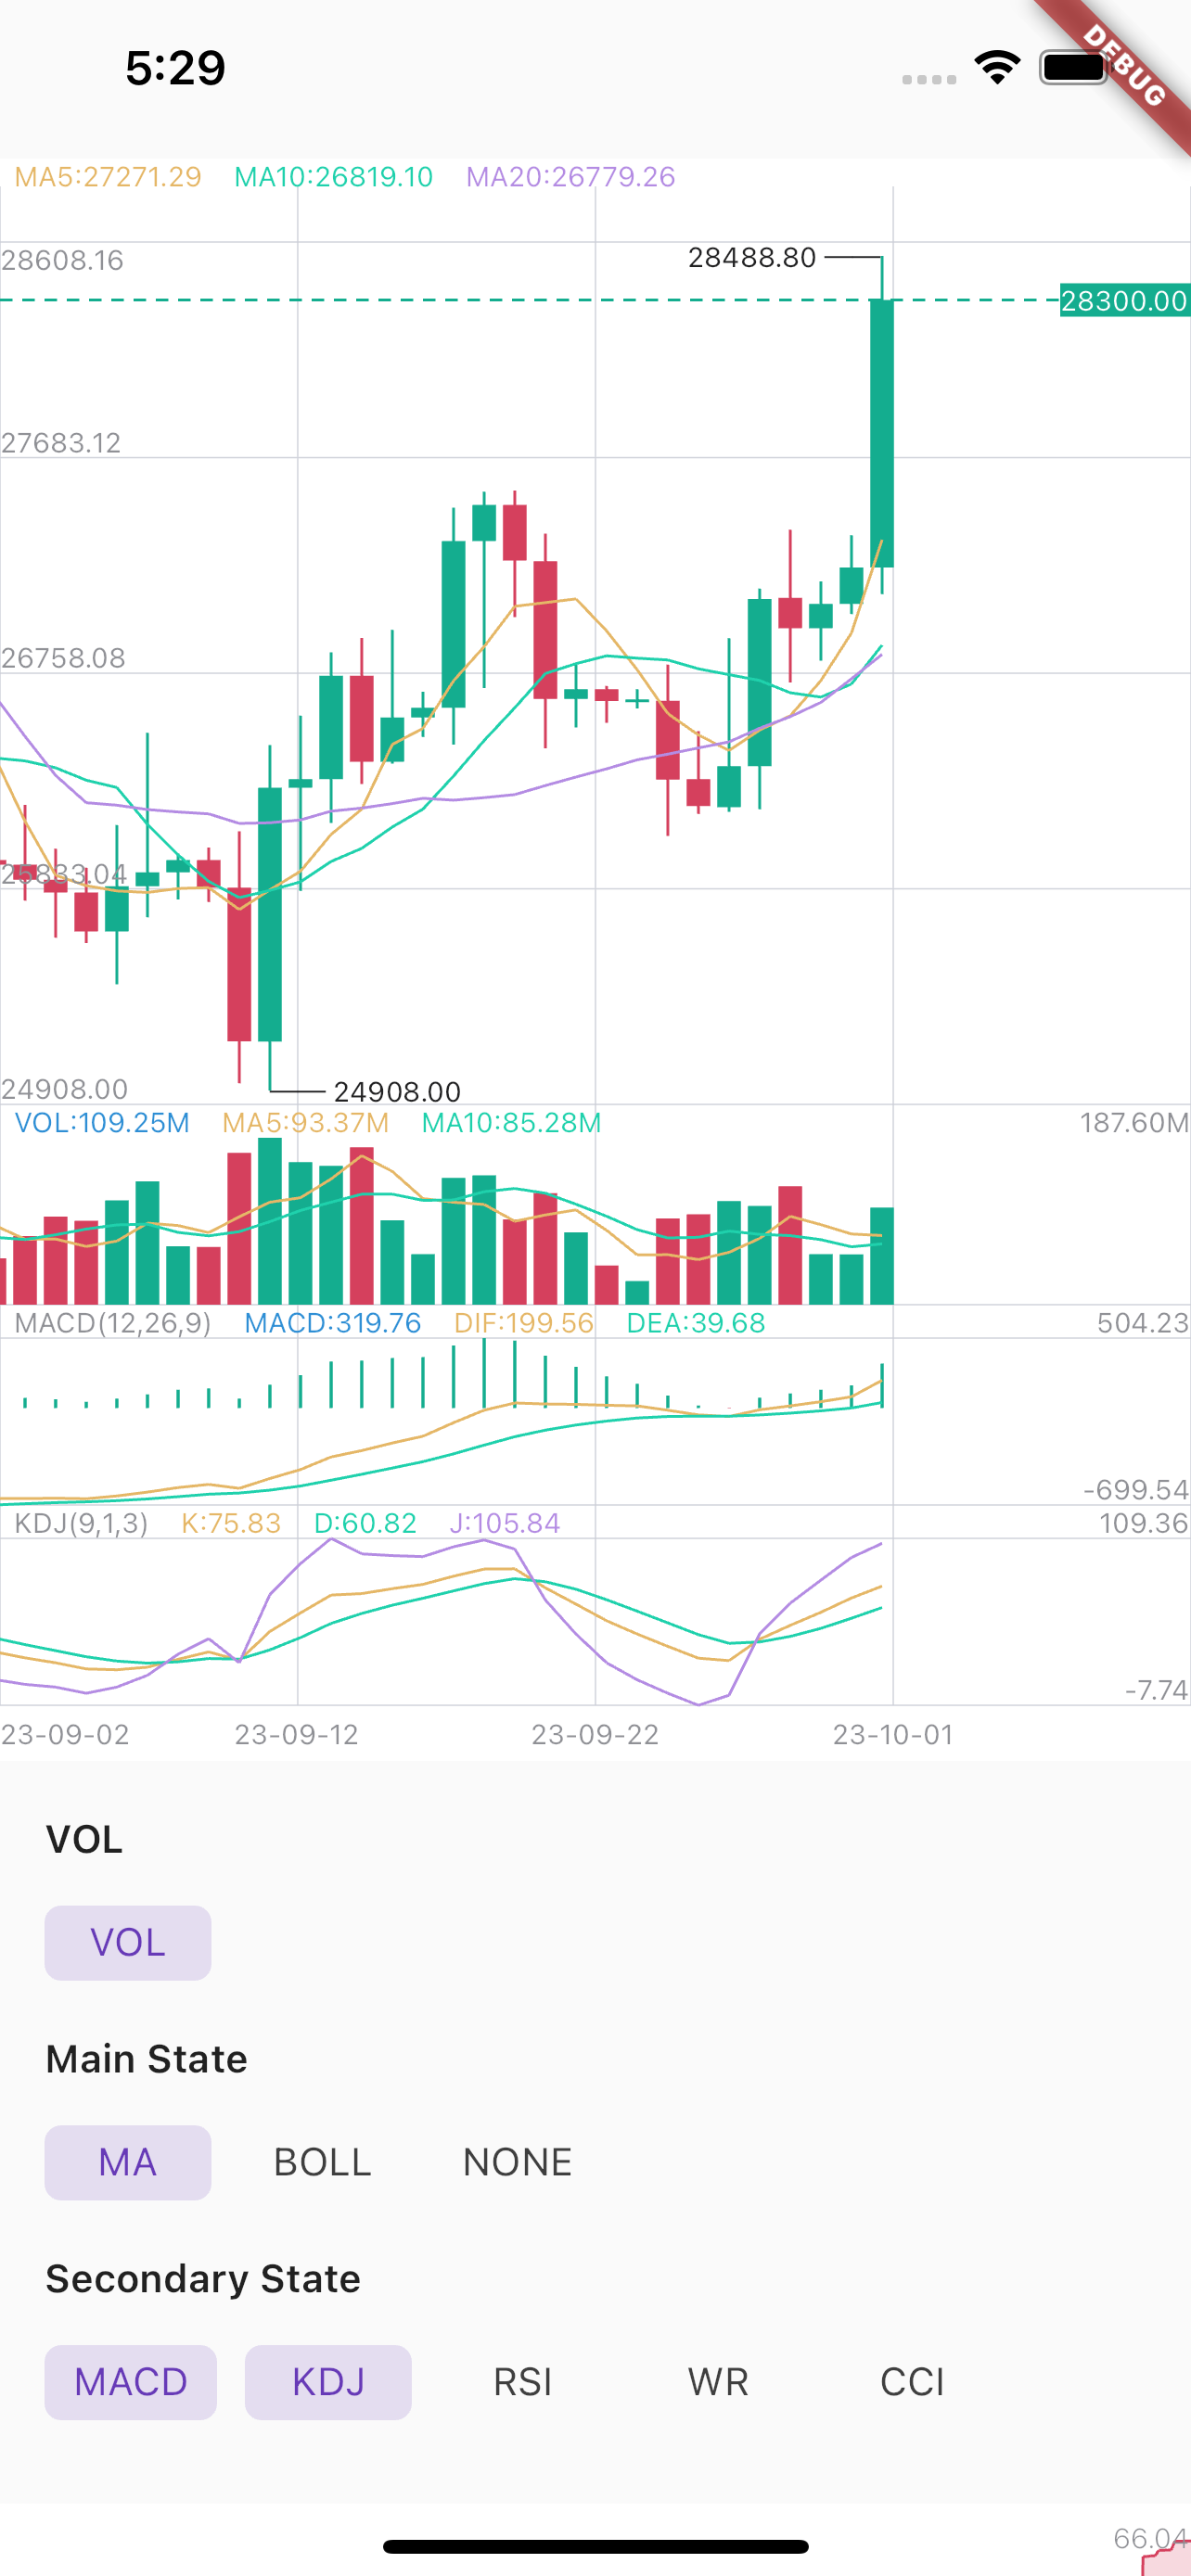
Charts library which paint candle chart, depth chart in Exchange Application, experienced software developer open to new opportunities, reach out via Telegram @sandaohaizi .
Package selection guidance compiled from public package information, community data, and project usage.
k_chart_plus_deeping is a Flutter package designed for building advanced financial charts, including candlestick and depth charts ideal for exchange applications. It provides smooth, customizable visualizations with support for real-time data updates. Built for experienced developers, it integrates seamlessly into trading or finance-focused apps across multiple platforms. The library is open-source and maintained by a developer open to collaboration via Telegram.
Use cases
Trading platform interfaces
Cryptocurrency exchange dashboards
Real-time market data visualization
Financial analytics tools
Portfolio tracking applications
Key features
Candlestick chart rendering
Depth chart visualization
Cross-platform compatibility
High-performance rendering
Customizable themes and styles
Real-time data streaming support
Suitable for
Experienced Flutter developers
Finance and crypto application builders
Exchange platform teams
Data visualization specialists
Apps requiring interactive charting
Considerations
Requires understanding of financial charting concepts
Best suited for complex trading UIs
May need additional state management
Limited documentation beyond GitHub repo
Telegram contact required for direct support
Original README
Original README snapshot from the linked source repository. Visit the repository for the latest content.
If you don't want to support selecting multiple secondary states, you need to use:
flutter_k_chat_plus:git:url:https://github.com/sawwas/flutter_k_chat_plusref:single#branch name
Usage
When you change the data, you must call this:
DataUtil.calculate(datas); //This function has some optional parameters: n is BOLL N-day closing price. k is BOLL param.
Use K line chart
KChartWidget(
chartStyle, // Required for styling purposes
chartColors,// Required for styling purposes
datas,// Required,Data must be an ordered list,(history=>now)
mBaseHeight: 360, //height of chart (not contain Vol and Secondary)
isLine: isLine,// Decide whether it is k-line or time-sharing
mainState: _mainState,// Decide what the main view shows
secondaryStateLi: _secondaryStateLi,// Decide what the sub view shows
fixedLength: 2,// Displayed decimal precision
timeFormat: TimeFormat.YEAR_MONTH_DAY,
onLoadMore: (bool a) {},// Called when the data scrolls to the end. When a is true, it means the user is pulled to the end of the right side of the data. When a// is false, it means the user is pulled to the end of the left side of the data.
maDayList: [5,10,20],// Display of MA,This parameter must be equal to DataUtil.calculate‘s maDayList
volHidden: false,// hide volume
showNowPrice: true,// show now price
isOnDrag: (isDrag){},// true is on Drag.Don't load data while Draging.
isTrendLine: false, // You can use Trendline by long-pressing and moving your finger after setting true to isTrendLine property.
xFrontPadding: 100// padding in front
),
Use Depth chart
DepthChart(_bids, _asks, chartColors) //Note: Datas must be an ordered list,
Dark | Light Theme
ChartColor helped to set the color for the chart. You need to flexibly change according to your theme configuration to ensure UI.
If you need to apply multi theme, you need to change at least the colors related to the text, border, grid and background color