Search packages, repositories and app categories

mrx_charts cover
Package detailsv0.1.3

mrx_charts

Simple, high-performance Flutter charts with beautiful animations.

AndroidiOSWebmacOSWindowsLinux
30-day downloads
4K
Likes
199
Pub points
160

Install package

flutter pub add mrx_charts

Package Overview

Package selection guidance compiled from public package information, community data, and project usage.

MRX Charts is a lightweight, high-performance Flutter package for creating visually appealing charts with smooth animations. Designed for simplicity and speed, it supports multiple chart types and integrates seamlessly into Flutter apps across all major platforms. With minimal setup and customizable styling, it's ideal for displaying data trends, metrics, and visual analytics in mobile, web, and desktop applications. The package emphasizes responsiveness and performance, making it suitable for real-time data visualization.

Use cases

  • Real-time data dashboards
  • Mobile app analytics
  • Web-based reporting tools
  • Desktop data visualization
  • Interactive UIs with dynamic charts

Key features

  • Smooth animated transitions
  • High performance rendering
  • Cross-platform compatibility
  • Simple API integration
  • Customizable chart styles
  • Support for multiple chart types

Suitable for

  • Developers building data-driven apps
  • Designers needing polished visuals
  • Teams targeting multiple platforms
  • Projects requiring fast chart rendering

Considerations

  • Limited to basic chart types
  • Minimal built-in interactivity
  • No advanced customization beyond styling
  • Best suited for simple to moderately complex charts
  • Requires manual handling of complex data updates
Original README

Original README snapshot from the linked source repository. Visit the repository for the latest content.

Charts Flutter

Simple and beautiful smooth animated charts.

Supported charts

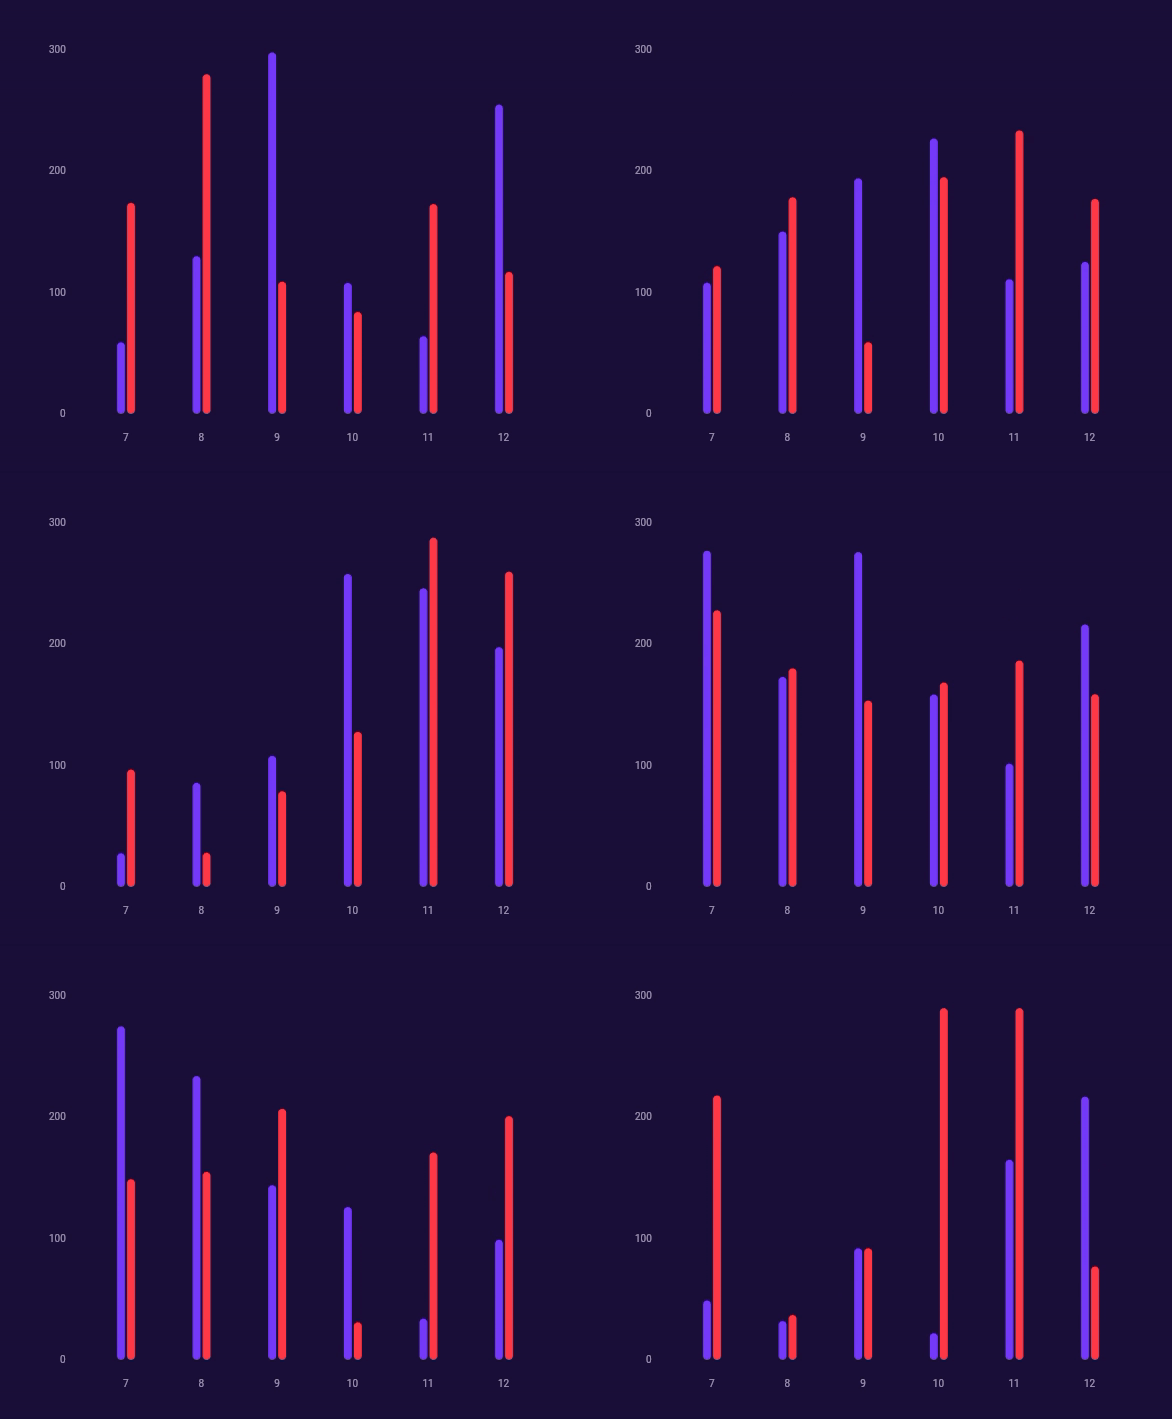
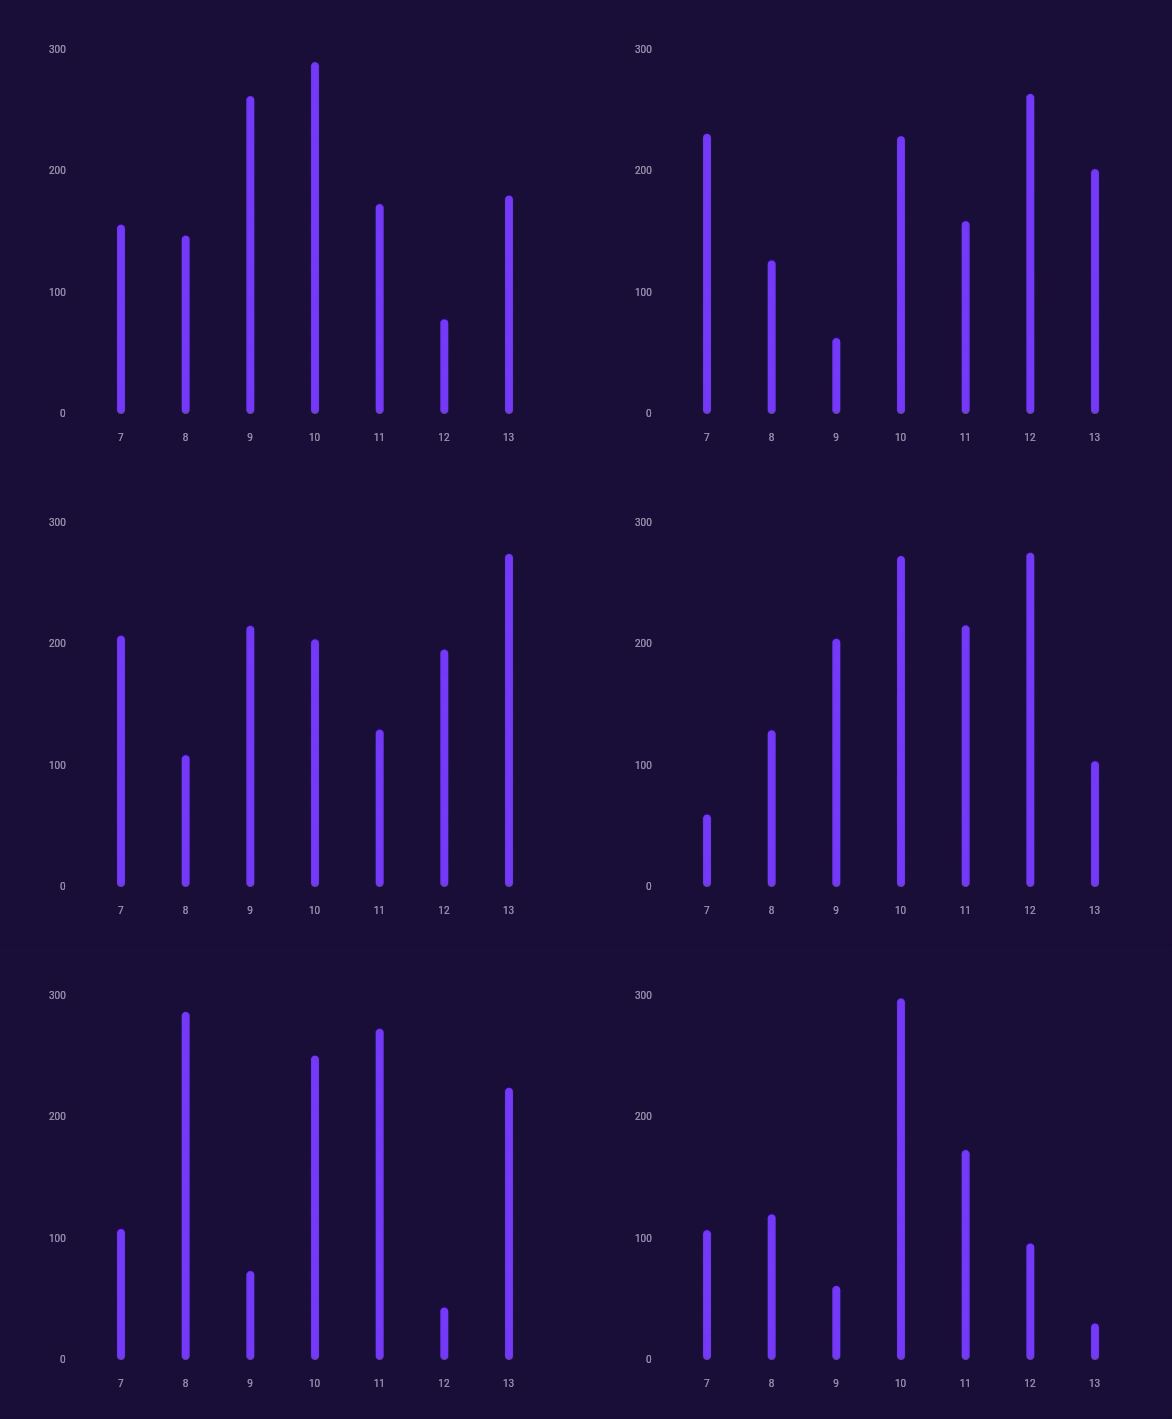
Bar

Screenshot1

Group bar

Screenshot2

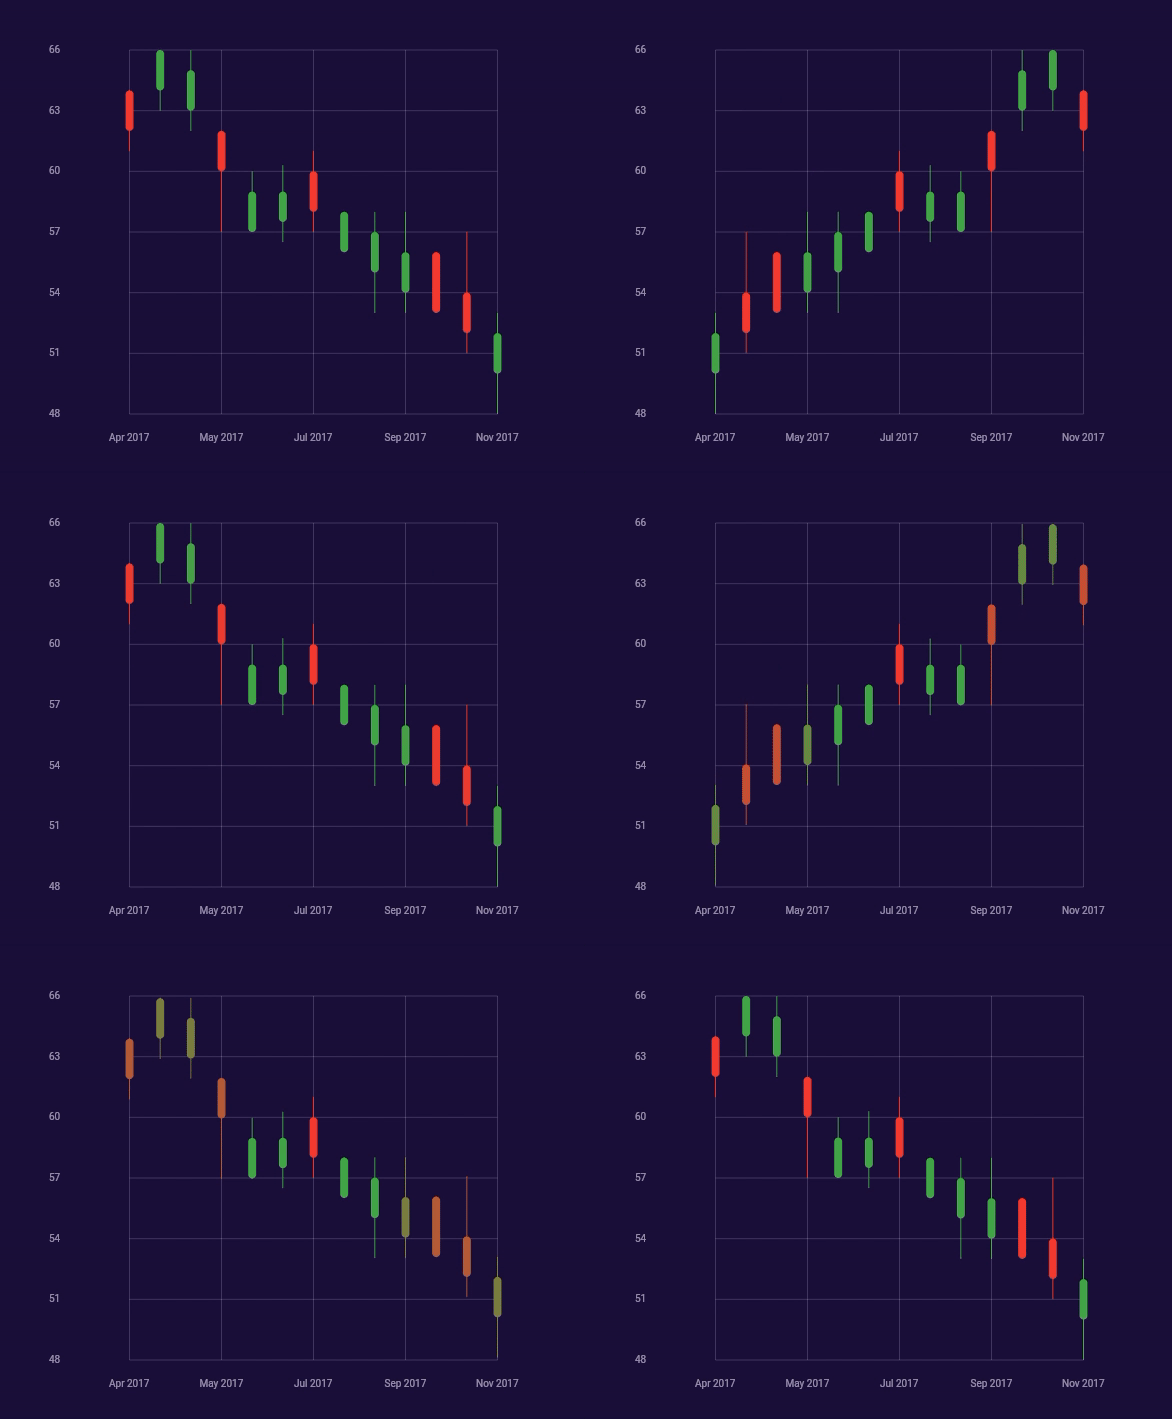
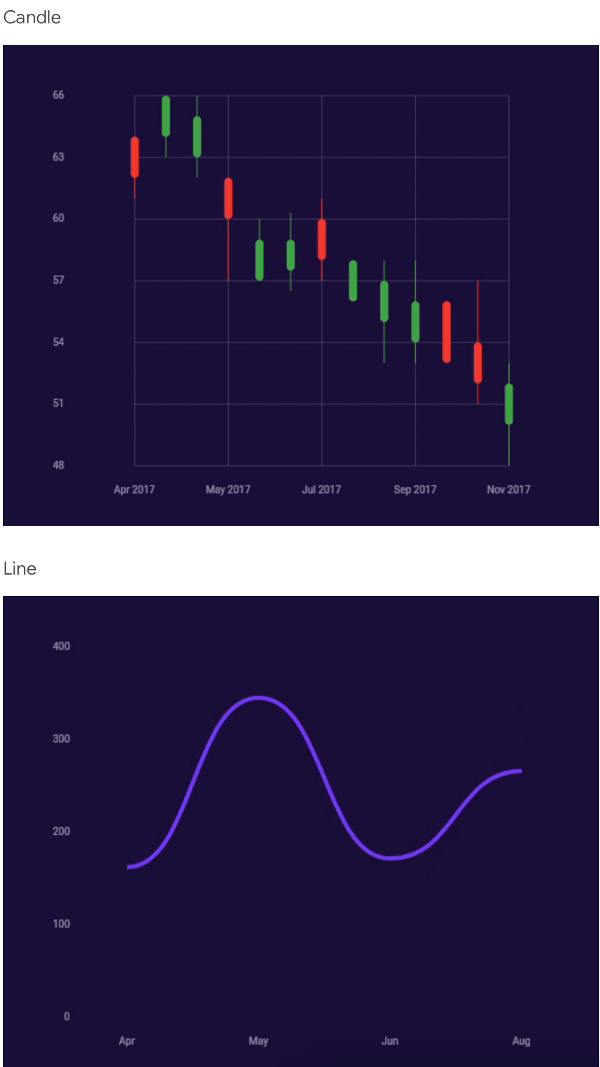
Candle

Screenshot3

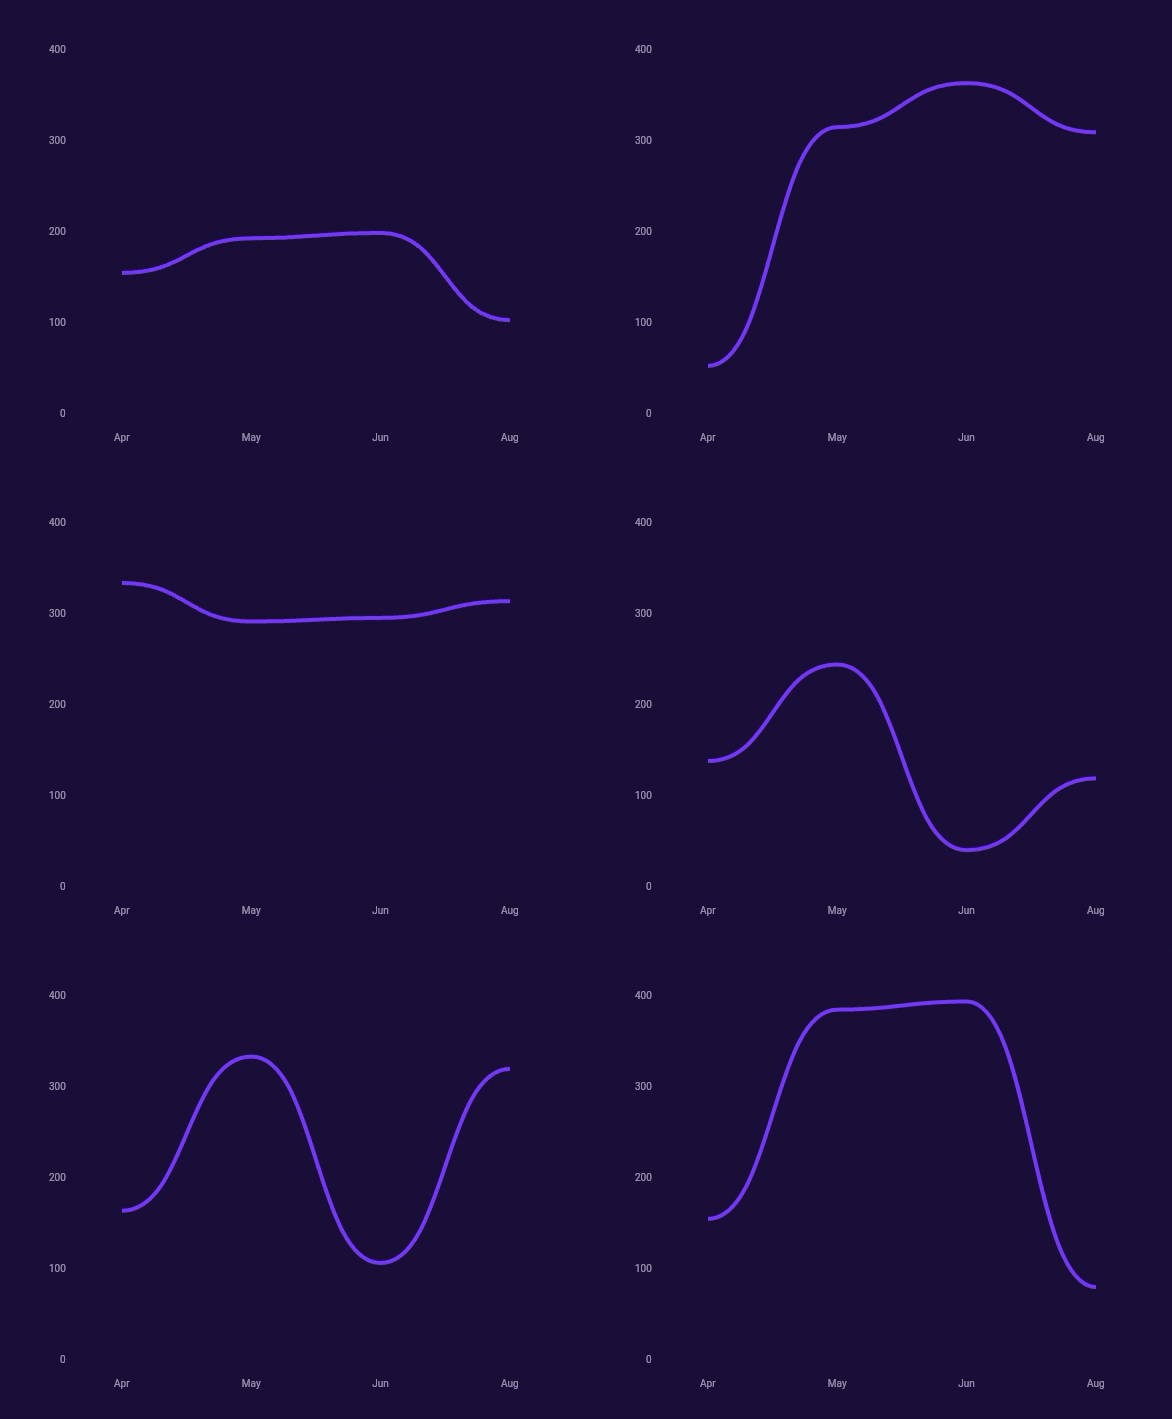
Line

Screenshot4

Pie

Screenshot5

Example

Check /example folder for more detailed usage

Chart(
  layers: [
    ChartAxisLayer(
      settings: ChartAxisSettings(
        x: ChartAxisSettingsAxis(
          frequency: 1.0,
          max: 13.0,
          min: 7.0,
          textStyle: TextStyle(
            color: Colors.white.withOpacity(0.6),
            fontSize: 10.0,
            ),
          ),
          y: ChartAxisSettingsAxis(
            frequency: 100.0,
            max: 300.0,
            min: 0.0,
            textStyle: TextStyle(
              color: Colors.white.withOpacity(0.6),
              fontSize: 10.0,
            ),
          ),
        ),
        labelX: (value) => value.toInt().toString(),
        labelY: (value) => value.toInt().toString(),
      ),
      ChartBarLayer(
        items: List.generate(
          13 - 7 + 1,
          (index) => ChartBarDataItem(
            color: const Color(0xFF8043F9),
            value: Random().nextInt(280) + 20,
            x: index.toDouble() + 7,
          ),
        ),
        settings: const ChartBarSettings(
          thickness: 8.0,
          radius: BorderRadius.all(Radius.circular(4.0)),
        ),
      ),
    ]
  ],
)

About

Developed with passion, by Merixstudio developers.

Categories

Source repository

Projects using this package