
Overview
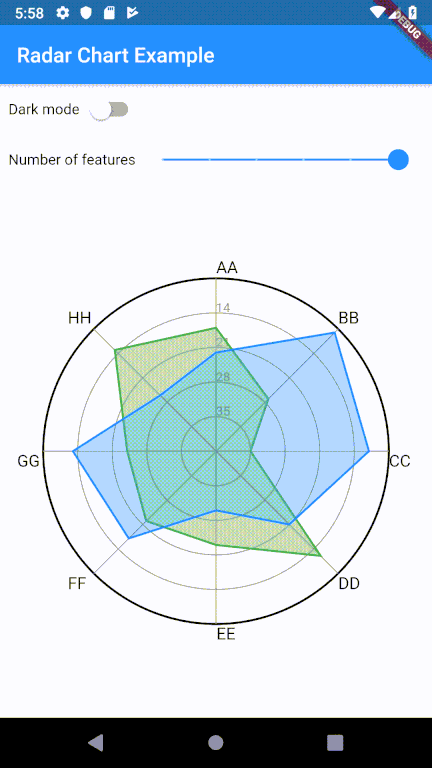
A simple, self-adjusting radar chart for Flutter, designed to work seamlessly with provided data. Inspired by the Python Graph Gallery, it offers a clean and intuitive visualization for multi-dimensional data. The chart automatically scales and adapts to input values, making it ideal for quick implementation without complex configuration. Suitable for dashboards, performance comparisons, and data analysis interfaces across multiple platforms.
Use cases
- Performance metric visualization
- Multi-dimensional data comparison
- Dashboard widgets
- Data analysis in apps
- Educational tools
Key features
- Auto-scaling based on data
- Minimal setup required
- Cross-platform support
- Clean, modern design
- Responsive layout
Suitable for
- Developers seeking quick radar charts
- Data visualization in dashboards
- Educational or analytical applications
- Apps with multi-axis data
- Projects requiring lightweight charts
Considerations
- Limited customization options
- Best suited for small to medium datasets
- Not ideal for highly interactive charts
- No built-in tooltips or animations
- Depends on external library for advanced features