Search packages, repositories and app categories

graphic cover
Package detailsv2.7.0

graphic

A grammar of data visualization and Flutter charting library.

AndroidiOSWebmacOSWindowsLinux
30-day downloads
42.4K
Likes
904
Pub points
160

Install package

flutter pub add graphic

Package Overview

Package selection guidance compiled from public package information, community data, and project usage.

Graphic is a Flutter charting library that provides a grammar of data visualization, enabling developers to create expressive and customizable charts with a declarative approach. Built for flexibility and performance, it supports multiple platforms including Android, iOS, Web, macOS, Windows, and Linux. The library emphasizes composability and intuitive syntax, making it easy to build complex visualizations from simple building blocks. It integrates seamlessly into Flutter apps and offers extensive configuration options for styling and interactivity.

Use cases

  • Creating interactive dashboards
  • Visualizing time-series data
  • Building custom data-driven UIs
  • Generating reports with charts
  • Real-time data visualization

Key features

  • Declarative chart syntax
  • Cross-platform support
  • Highly customizable components
  • Built-in animation support
  • Extensible design system

Suitable for

  • Data visualization developers
  • Flutter app creators
  • Analytics dashboard builders
  • Educational app developers
  • UI designers working with data

Considerations

  • Requires understanding of data visualization principles
  • Steeper learning curve for beginners
  • Limited documentation compared to mature libraries
  • Performance may vary with large datasets
  • Custom styling requires familiarity with Flutter's widget system

Original README

Original README snapshot from the linked source repository. Visit the repository for the latest content.

Graphic

Graphic is a grammar of data visualization and Flutter charting library.
  • Flexible declarative grammar: This visualization grammar derives from Leland Wilkinson's The Grammar of Graphics, and tries to balance between theoretical beauty and practicability. Data processing steps and mark shapes can be composed freely in a declarative specification, not limited to certain chart types. And shape draw methods are customizable.
  • Interaction: With the event and selection definition, the chart is highly interactive, such as highlighting selected items, popping a tooltip, or scaling the coordinate.
  • Animation: Mark transition animation can be set when a chart is built or changed. The entrance animation has various forms.

Skill for AI coding

Add the following skill, and your coding agent will be an expert of charting with this library:

npx skills add https://github.com/entronad/graphic --skill flutter-chart

Or you can find the skill in /skills/flutter-chart of this repository.

Documentation

See in the documentation.

(But in fact, I would prefer you to use the skill above for your coding agent.)

Examples

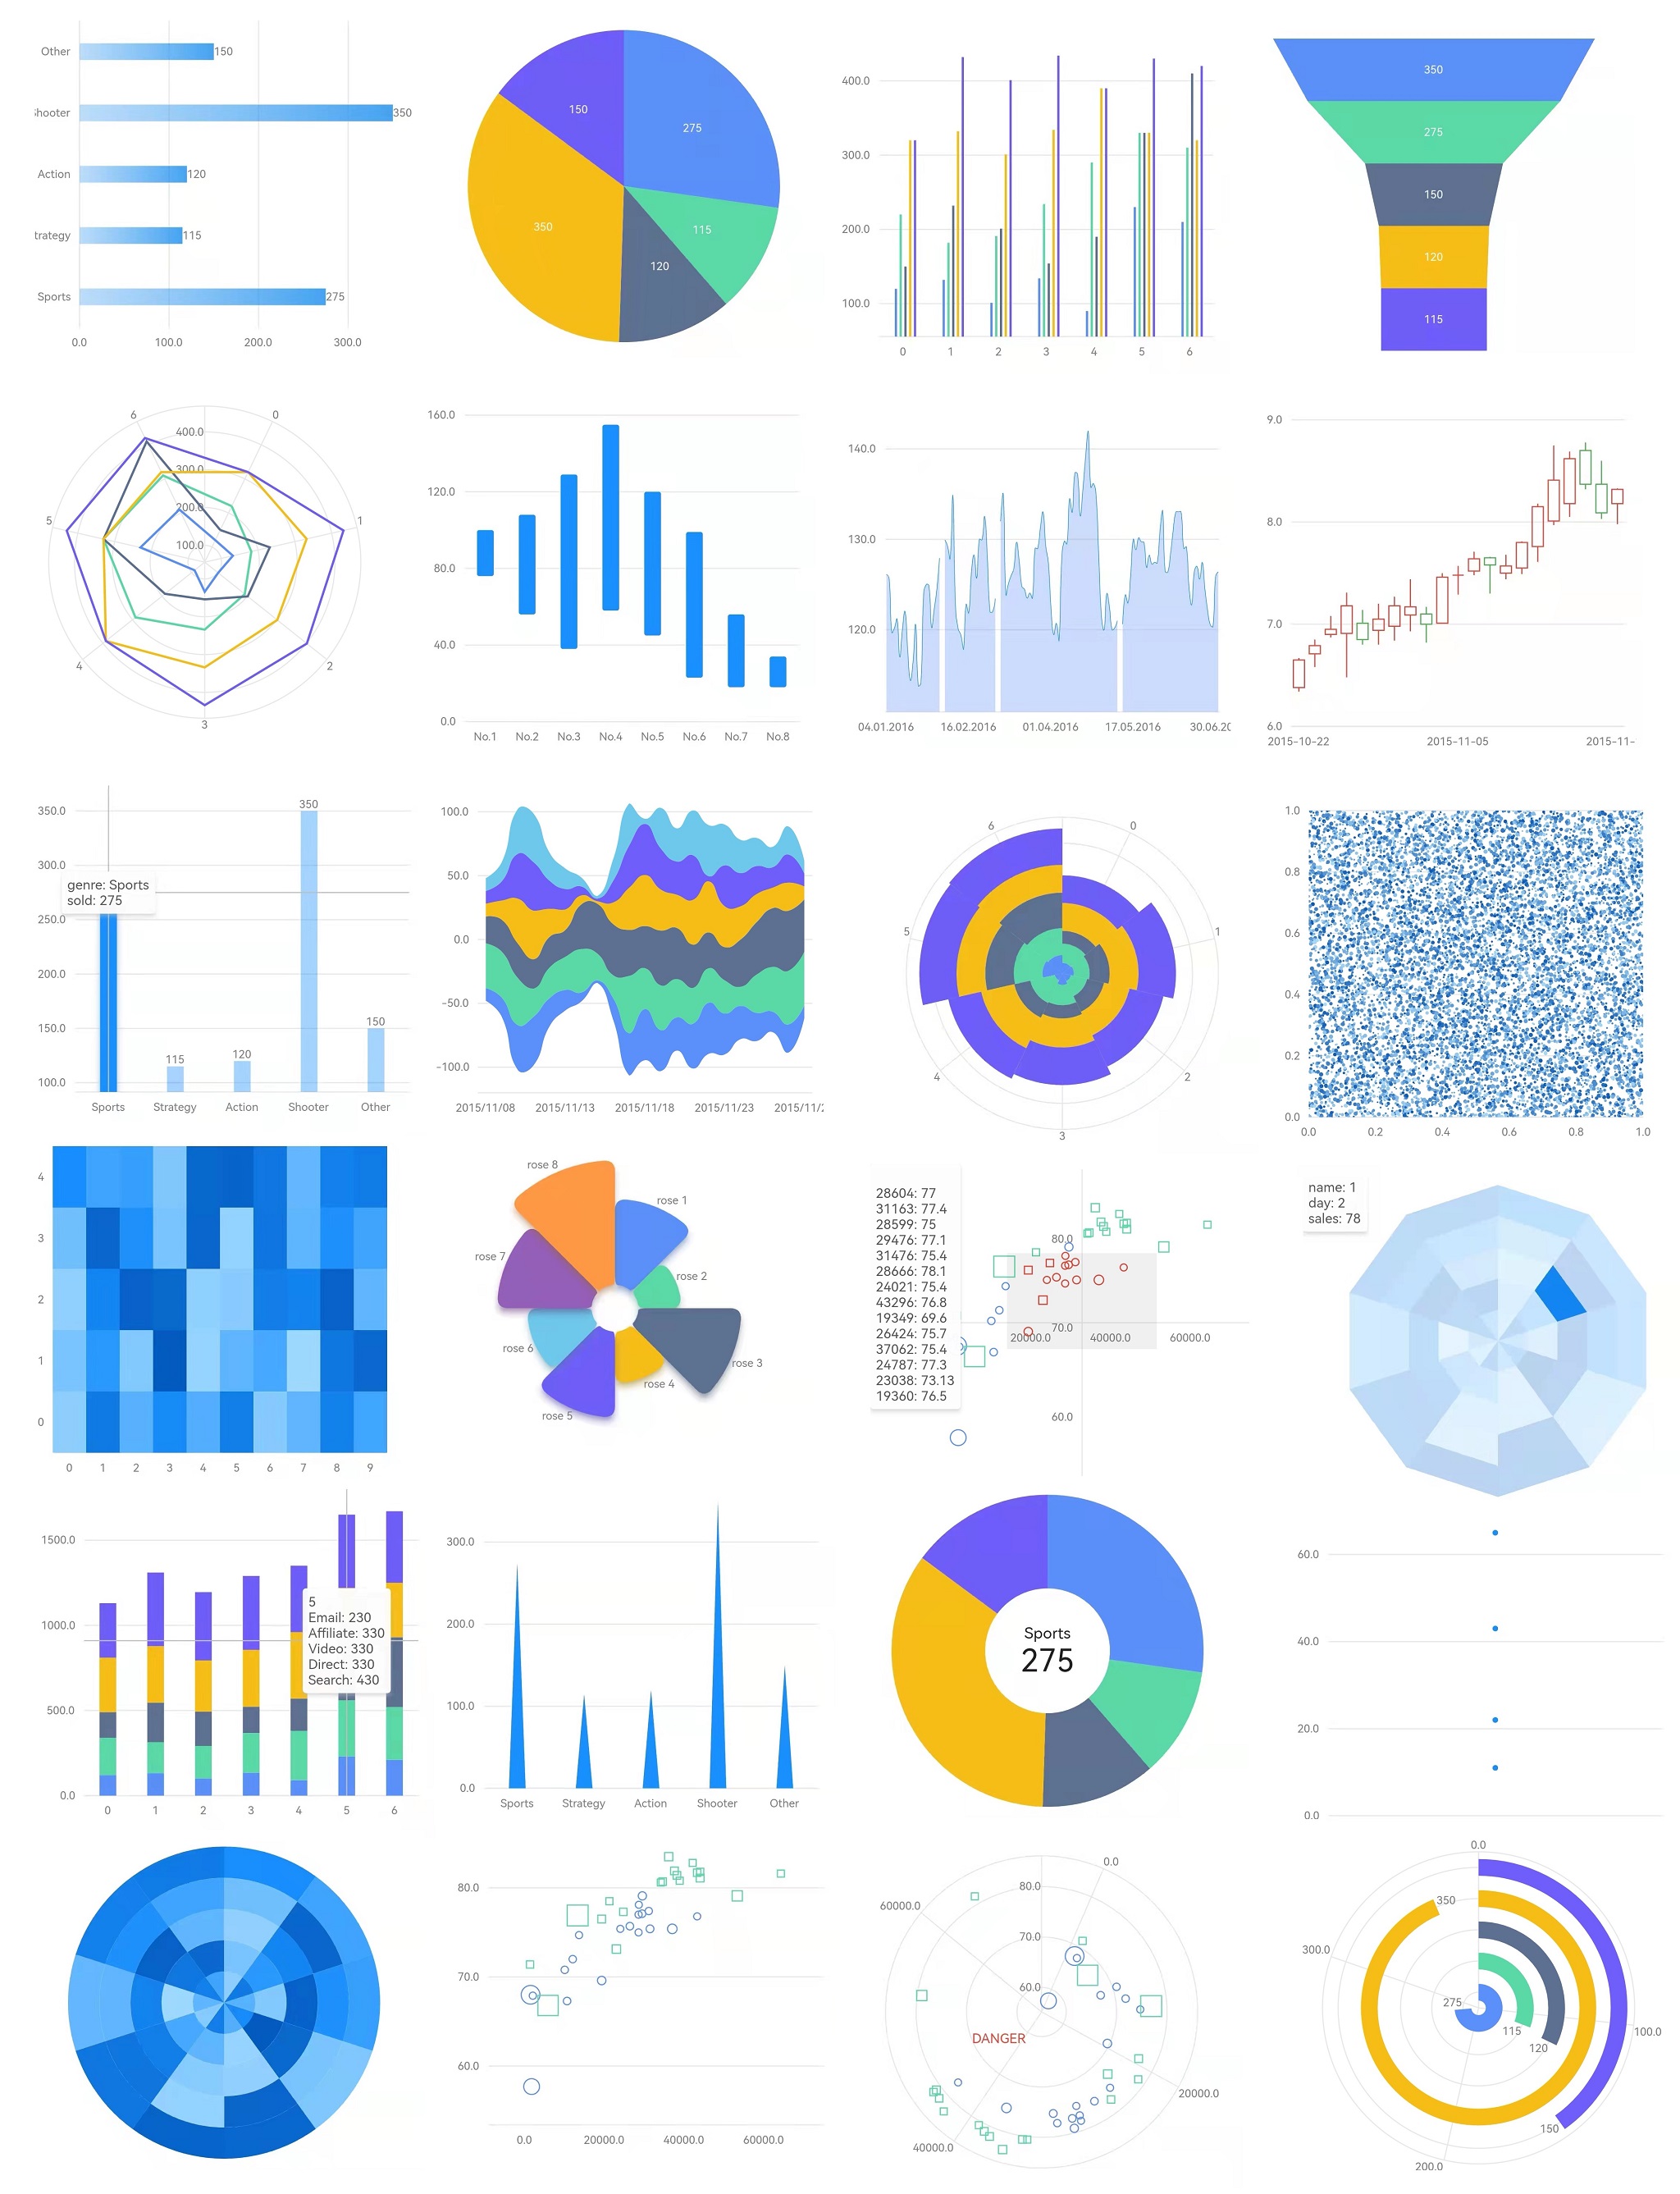
Example of charts can be seen in the Example App. Please clone this repository and run the example project in example directory.

examples

Tutorials

The Versatility of the Grammar of Graphics

How to Build Interactive Charts in Flutter

Share this Lib

Twitter HackerNews Reddit

License

Graphic is MIT License.

Keep Informed

Twitter

Medium

Zhihu

Thanks for reading.

Categories

Dependencies

Dependency list 3 items

Source repository

Projects using this package