Search packages, repositories and app categories

flutter_sales_graph cover
Package detailsv0.0.5

flutter_sales_graph

A Flutter package for displaying sales data in a bar chart format.

AndroidiOSWebmacOSWindowsLinux
30-day downloads
36
Likes
9
Pub points
150

Install package

flutter pub add flutter_sales_graph

Package Overview

Package selection guidance compiled from public package information, community data, and project usage.

A Flutter package designed to visualize sales data using intuitive bar charts. It enables developers to easily integrate responsive and customizable bar charts into their applications, ideal for dashboards or analytics interfaces. The package supports multiple platforms including Android, iOS, Web, macOS, Windows, and Linux, ensuring cross-platform consistency. With simple configuration options, it renders clean, interactive charts that adapt to varying data sets and screen sizes.

Use cases

  • Sales dashboard visualization
  • Real-time data tracking
  • Business analytics apps
  • E-commerce performance monitoring
  • Reporting tools

Key features

  • Bar chart rendering
  • Cross-platform support
  • Customizable colors and labels
  • Responsive design
  • Easy integration with data streams
  • Smooth animations

Suitable for

  • Developers building business apps
  • Analytics dashboard creators
  • E-commerce platform teams
  • Data visualization beginners
  • Flutter projects requiring sales metrics

Considerations

  • Requires data in a compatible format
  • Limited to bar chart type
  • May need additional styling for complex UIs
  • Depends on Flutter's rendering engine
  • Not suitable for non-sales data types

Original README

Original README snapshot from the linked source repository. Visit the repository for the latest content.

flutter_sales_graph

A Flutter package for displaying customizable bar charts for sales data.

Features

  • Displays a bar chart with customizable bar appearance and layout.
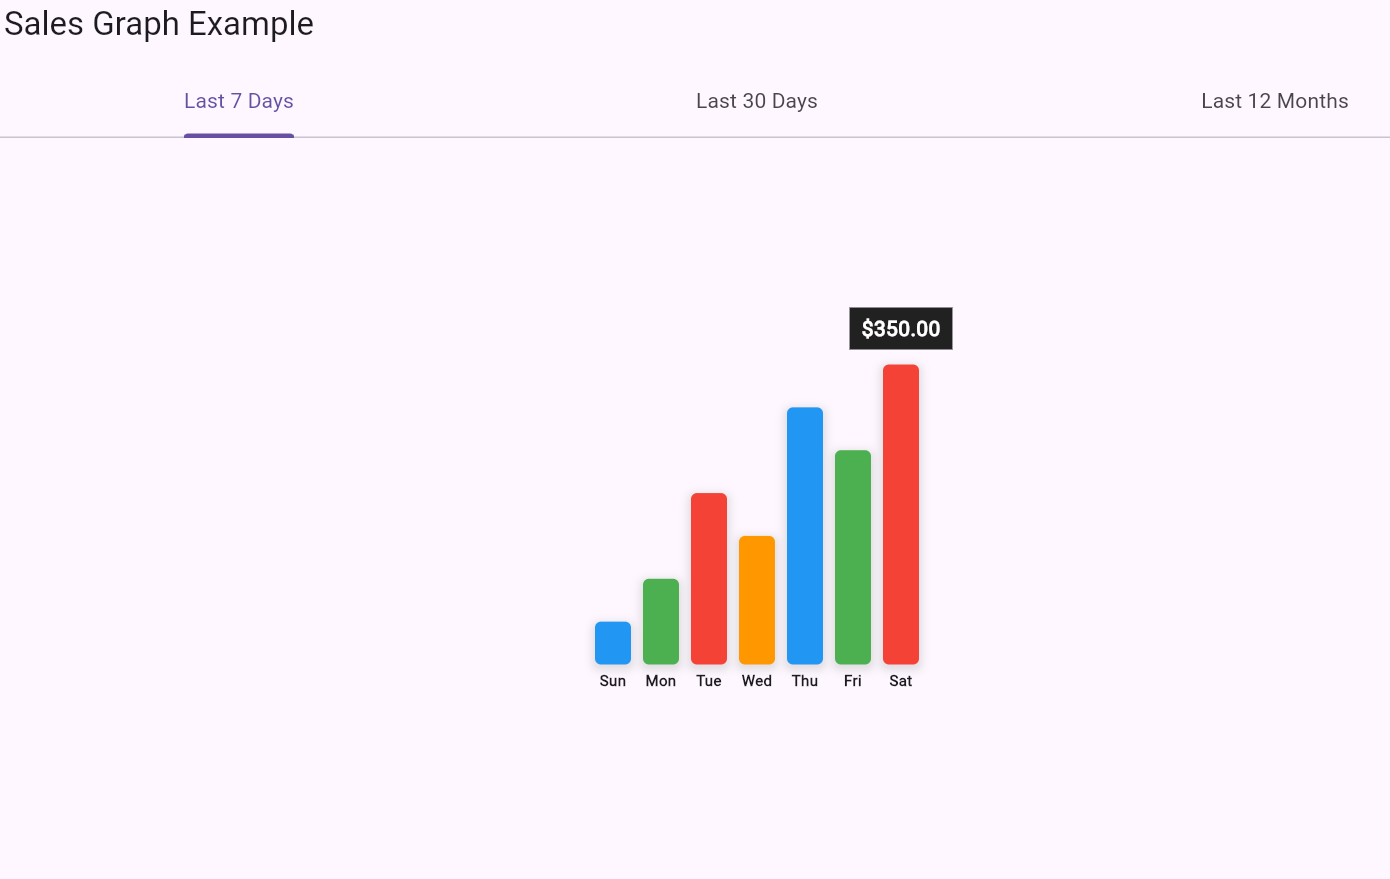
  • Supports different time ranges (e.g., Last 7 Days, Last 30 Days, Last 12 Months).
  • Customizable parameters for bar height, width, colors, and labels.

Platforms Supported

  • Android: Yes
  • iOS: Yes
  • Web: Yes
  • Windows: Yes
  • macOS: Yes
  • Linux: Yes

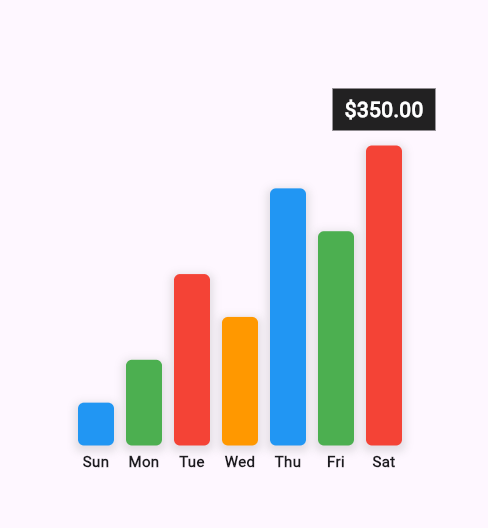
Screenshot

Sales Graph Screenshot

Installation

To use the flutter_sales_graph package in your Flutter project, follow these steps:

  1. Add flutter_sales_graph to your pubspec.yaml file:

    dependencies:
      flutter_sales_graph: ^0.0.5
    
  2. Run flutter pub get to install the package.

Usage

Here’s a basic example of how to use the FlutterSalesGraph widget in your Flutter app:

  1. Import the package:

    import 'package:flutter_sales_graph/flutter_sales_graph.dart';
    
  2. Use the FlutterSalesGraph widget:

     import 'package:flutter/material.dart';
    import 'package:flutter_sales_graph/flutter_sales_graph.dart';
    
    void main() {
    

runApp(MyApp()); }

class MyApp extends StatelessWidget { @override Widget build(BuildContext context) { return MaterialApp( home: Scaffold( appBar: AppBar(title: Text('Sales Graph Example')), body: Center( child: FlutterSalesGraph( salesData: [100, 200, 150, 300, 250, 350], labels: ['Jan', 'Feb', 'Mar', 'Apr', 'May', 'Jun'], maxBarHeight: 250.0, barWidth: 30.0, colors: [Colors.blue, Colors.green, Colors.red], dateLineHeight: 20.0, ), ), ), ); } }

```

Parameters

  • salesData: A List<double> representing the sales values. Must be non-empty.
  • labels: A List<String> representing the labels corresponding to each bar. Must be non-empty and the same length as salesData.
  • selectedRange: A String to indicate the selected time range for the graph. (For display purposes; not functional in this package).
  • maxBarHeight: A double specifying the maximum height of the bars in the graph.
  • barWidth: A double specifying the width of each bar in the graph.
  • colors: A List<Color> providing the colors for the bars.
  • dateLineHeight: A double specifying the height of the labels below the bars.

Example

For a full example of how to use this package, see the example directory in the GitHub repository.

Development

If you’d like to contribute to this package, please follow these guidelines:

  1. Fork the repository:

    • Click the "Fork" button on the top-right corner of github page.
  2. Clone your fork:

    git clone https://github.com/AsherAyub80/flutter_sales_graph.git
    
    
  3. Create a branch for your changes:

    git checkout -b feature/your-feature-name
    
  4. Make your changes and commit them:

          git add .
          git commit -m "Add feature: your feature description"
    
  5. Push your changes:

        git push origin feature/your-feature-name
    
  6. Create a pull request:

    Go to the repository on GitHub and click the "New Pull Request" button.

Categories

Source repository

Projects using this package

No data available yet.