Search packages, repositories and app categories

Package detailsv0.1.0

flutter_circular_chart

Animated radial and pie charts for Flutter

30-day downloads
282
Likes
91
Pub points
20

Install package

flutter pub add flutter_circular_chart

Package Overview

Package selection guidance compiled from public package information, community data, and project usage.

A Flutter package for creating animated radial and pie charts. It provides smooth, customizable visualizations ideal for displaying percentage-based data in a compact, visually appealing format. The charts support dynamic updates and are designed to integrate seamlessly into Flutter applications. With simple configuration options, developers can easily render engaging circular charts for dashboards, statistics, or progress indicators.

Use cases

  • Displaying percentage data
  • Creating dashboard widgets
  • Visualizing progress metrics
  • Building interactive reports
  • Enhancing app UI with animations

Key features

  • Animated transitions
  • Radial and pie chart types
  • Customizable colors and labels
  • Responsive design
  • Easy integration with Flutter

Suitable for

  • Data visualization apps
  • Dashboard interfaces
  • Progress tracking features
  • Educational tools
  • Mobile analytics dashboards

Considerations

  • Limited to circular chart types
  • Minimal customization for complex layouts
  • No built-in tooltips or interactions
  • Best suited for simple datasets
  • Requires manual handling of large data sets

Original README

Original README snapshot from the linked source repository. Visit the repository for the latest content.

pub package

Flutter Circular Chart

A library for creating animated circular chart widgets with Flutter, inspired by Zero to One with Flutter.

Overview

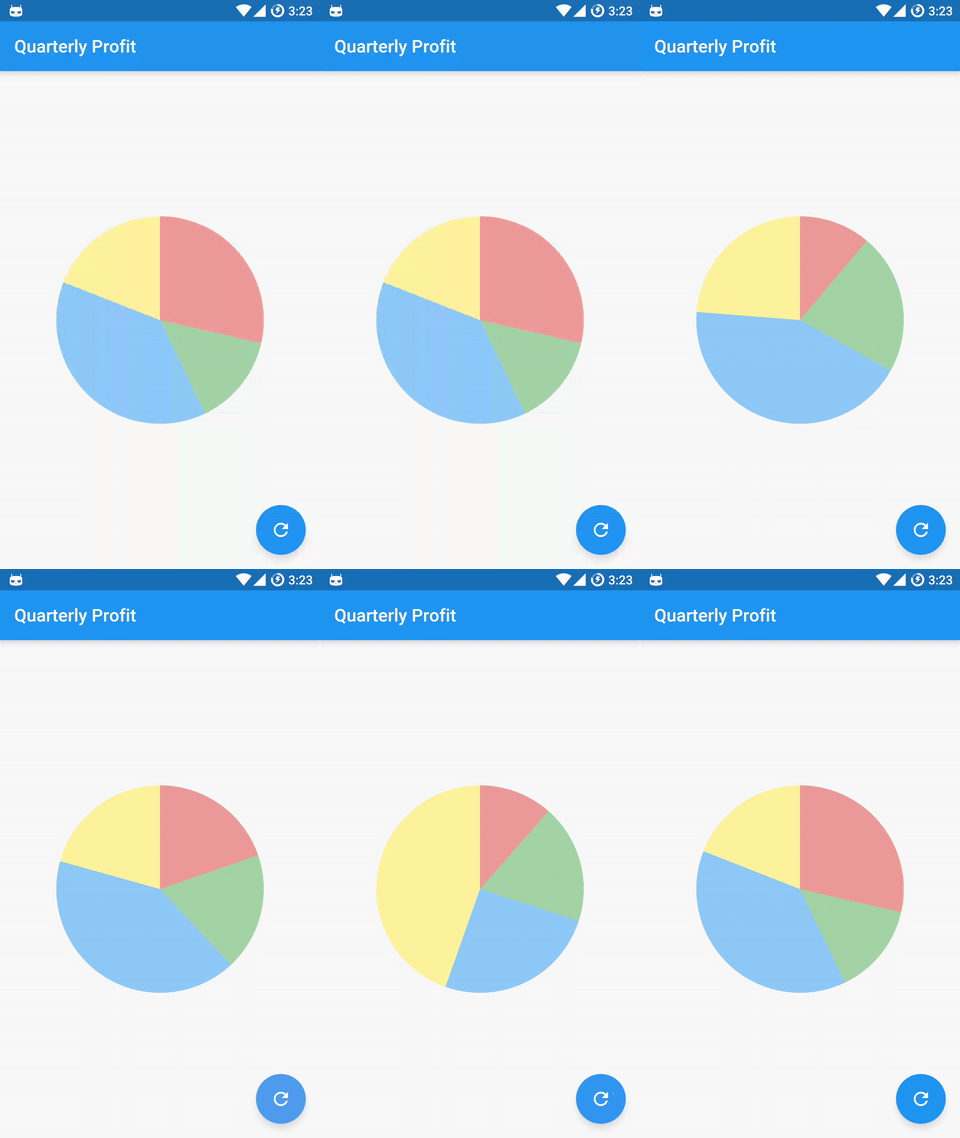
Create easily animated pie charts and radial charts by providing them with data objects they can plot into charts and animate between.

animated_random_radial_chart

animated pie chart animated radial chart

Check the examples folder for the source code for the above screenshots.

Contents:

Installation

Install the latest version from pub.

Getting Started

Import the package:

import 'package:flutter_circular_chart/flutter_circular_chart.dart';

Create a GlobalKey to be able to access the chart and update its data:

final GlobalKey<AnimatedCircularChartState> _chartKey = new GlobalKey<AnimatedCircularChartState>();

Create chart data entry objects:

List<CircularStackEntry> data = <CircularStackEntry>[
  new CircularStackEntry(
    <CircularSegmentEntry>[
      new CircularSegmentEntry(500.0, Colors.red[200], rankKey: 'Q1'),
      new CircularSegmentEntry(1000.0, Colors.green[200], rankKey: 'Q2'),
      new CircularSegmentEntry(2000.0, Colors.blue[200], rankKey: 'Q3'),
      new CircularSegmentEntry(1000.0, Colors.yellow[200], rankKey: 'Q4'),
    ],
    rankKey: 'Quarterly Profits',
  ),
];

Create an AnimatedCircularChart, passing it the _chartKey and initial data:

@override
Widget build(BuildContext context) {
  return new AnimatedCircularChart(
    key: _chartKey,
    size: const Size(300.0, 300.0),
    initialChartData: data,
    chartType: CircularChartType.Pie,
  );
}

Call updateData to animate the chart:

void _cycleSamples() {
  List<CircularStackEntry> nextData = <CircularStackEntry>[
    new CircularStackEntry(
      <CircularSegmentEntry>[
        new CircularSegmentEntry(1500.0, Colors.red[200], rankKey: 'Q1'),
        new CircularSegmentEntry(750.0, Colors.green[200], rankKey: 'Q2'),
        new CircularSegmentEntry(2000.0, Colors.blue[200], rankKey: 'Q3'),
        new CircularSegmentEntry(1000.0, Colors.yellow[200], rankKey: 'Q4'),
      ],
      rankKey: 'Quarterly Profits',
    ),
  ];
  setState(() {
    _chartKey.currentState.updateData(nextData);
  });
}

Customization

Hole Label:
Property Default
holeLabel null
labelStyle Theme.of(context).textTheme.body2

Example:

new AnimatedCircularChart(
  key: _chartKey,
  size: _chartSize,
  initialChartData: <CircularStackEntry>[
    new CircularStackEntry(
      <CircularSegmentEntry>[
        new CircularSegmentEntry(
          33.33,
          Colors.blue[400],
          rankKey: 'completed',
        ),
        new CircularSegmentEntry(
          66.67,
          Colors.blueGrey[600],
          rankKey: 'remaining',
        ),
      ],
      rankKey: 'progress',
    ),
  ],
  chartType: CircularChartType.Radial,
  percentageValues: true,
  holeLabel: '1/3',
  labelStyle: new TextStyle(
    color: Colors.blueGrey[600],
    fontWeight: FontWeight.bold,
    fontSize: 24.0,
  ),
)

hole label example screenshot


Segment Edge Style:
Property Default
edgeStyle SegmentEdgeStyle.flat
SegmentEdgeStyle Description
flat (default) Segments begin and end with a flat edge.
round Segments begin and end with a semi-circle.

Example:

new AnimatedCircularChart(
  key: _chartKey,
  size: _chartSize,
  initialChartData: <CircularStackEntry>[
    new CircularStackEntry(
      <CircularSegmentEntry>[
        new CircularSegmentEntry(
          33.33,
          Colors.blue[400],
          rankKey: 'completed',
        ),
        new CircularSegmentEntry(
          66.67,
          Colors.blueGrey[600],
          rankKey: 'remaining',
        ),
      ],
      rankKey: 'progress',
    ),
  ],
  chartType: CircularChartType.Radial,
  edgeStyle: SegmentEdgeStyle.round,
  percentageValues: true,
)

round segment edge example screenshot

Details

Chart data entries:

Charts expect a list of CircularStackEntry objects containing the data they need to be drawn.

Each CircularStackEntry corresponds to a complete circle in the chart. For radial charts that is one of the rings, for pie charts it is the whole pie.

Radial charts with multiple CircularStackEntrys will display them as concentric circles.

Each CircularStackEntry is composed of multiple CircularSegmentEntrys containing the value of a data point. In radial charts a segment corresponds to an arc segment of the current ring, for pie charts it is an individual slice.

Categories

Source repository

Projects using this package