
Overview
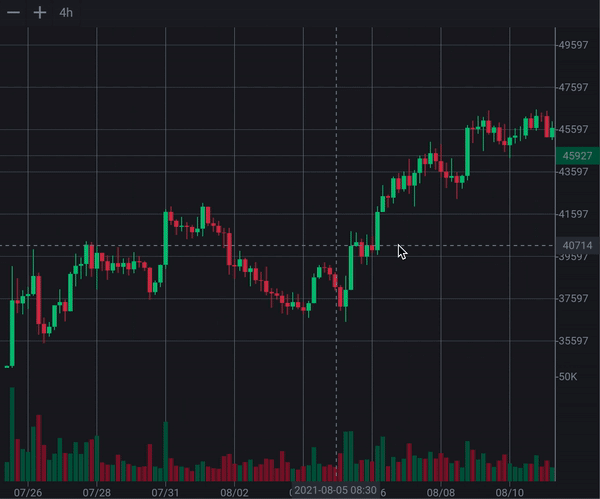
A high-performance, interactive candlestick chart package designed for financial applications in Flutter. It enables real-time visualization of price movements with smooth rendering across Android, iOS, Web, macOS, Windows, and Linux. The package supports touch interactions like panning and zooming, making it ideal for trading platforms and financial dashboards. Built with Dart, it integrates seamlessly into Flutter apps and leverages efficient rendering to handle large datasets without performance degradation.
Use cases
- Real-time stock price tracking
- Cryptocurrency market analysis
- Trading platform UIs
- Financial data dashboards
- Historical price visualization
Key features
- Interactive panning and zooming
- High-performance rendering
- Cross-platform support
- Real-time data updates
- Customizable chart appearance
Suitable for
- Financial app developers
- Trading interface designers
- Data visualization engineers
- Crypto analytics tools
- Stock market monitoring apps
Considerations
- Requires understanding of financial data structures
- Best suited for time-series price data
- May need additional state management for dynamic updates
- Limited to candlestick-specific visualizations
- Depends on external data sources for live feeds