
Overview
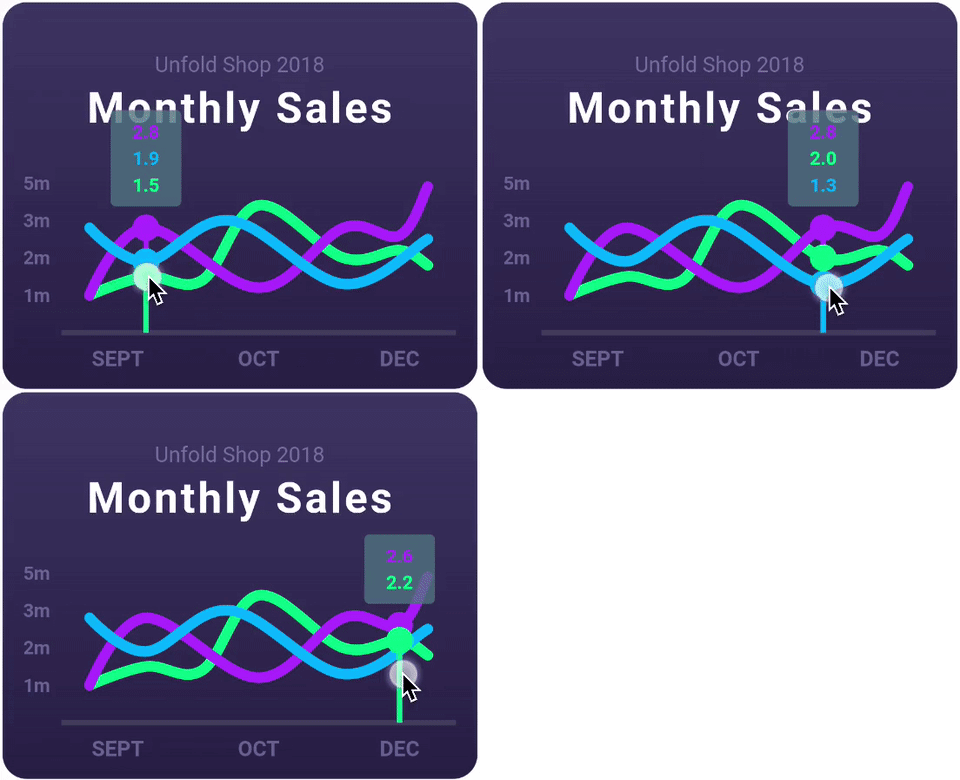
fl_chart is a highly customizable Flutter library for creating interactive and visually appealing charts. It supports multiple chart types including Line, Bar, Pie, Scatter, and Radar Charts, making it ideal for data visualization in apps. Designed with performance and flexibility in mind, it offers extensive customization options for colors, labels, animations, and touch interactions. The library is actively maintained and compatible across all major platforms: Android, iOS, Web, macOS, Windows, and Linux. With a clean API and comprehensive documentation, fl_chart simplifies the integration of complex charts into Flutter applications.
Use cases
- Displaying real-time data trends
- Visualizing user analytics
- Presenting financial or sales data
- Creating interactive dashboards
- Educational data representation
Key features
- Supports 5 chart types
- Highly customizable appearance
- Built-in animations and gestures
- Cross-platform compatibility
- Lightweight and performant
- Extensive configuration options
Suitable for
- Data-driven applications
- Dashboards and reporting tools
- Mobile and web analytics
- Educational and productivity apps
- Prototyping interactive visualizations
Considerations
- Requires understanding of chart-specific configurations
- May need optimization for large datasets
- Custom styling can increase complexity
- Limited built-in tooltips (requires custom implementation)
- Not ideal for extremely complex scientific visualizations