Package selection guidance compiled from public package information, community data, and project usage.
fl_animated_linechart is a Flutter package for creating animated line and area charts with smooth performance even on large datasets. It supports multiple Y-axes for comparing different data scales and features a datetime-based X-axis, ideal for time-series visualization. The package is optimized for responsiveness across platforms, making it suitable for real-time or dynamic data displays. Built with Flutter's rendering engine, it ensures fluid animations and efficient updates without sacrificing visual quality.
Use cases
Real-time data monitoring
Time-series analysis
Multi-metric dashboards
Financial charting
Interactive data exploration
Key features
Animated transitions
Multiple Y-axes support
Datetime X-axis
High performance with big data
Cross-platform compatibility
Suitable for
Data visualization apps
Dashboard developers
Analytics tools
Mobile and web analytics
Real-time tracking interfaces
Considerations
Requires careful handling of large datasets to maintain frame rate
Limited customization beyond core chart types
May need additional styling for complex UIs
Best suited for linear or time-based data patterns
Depends on external dependencies for advanced features
Original README
Original README snapshot from the linked source repository. Visit the repository for the latest content.
fl_animated_linechart
An animated chart library for flutter.
Support for datetime axis
Multiple y axis, supporting different units
Highlight selection
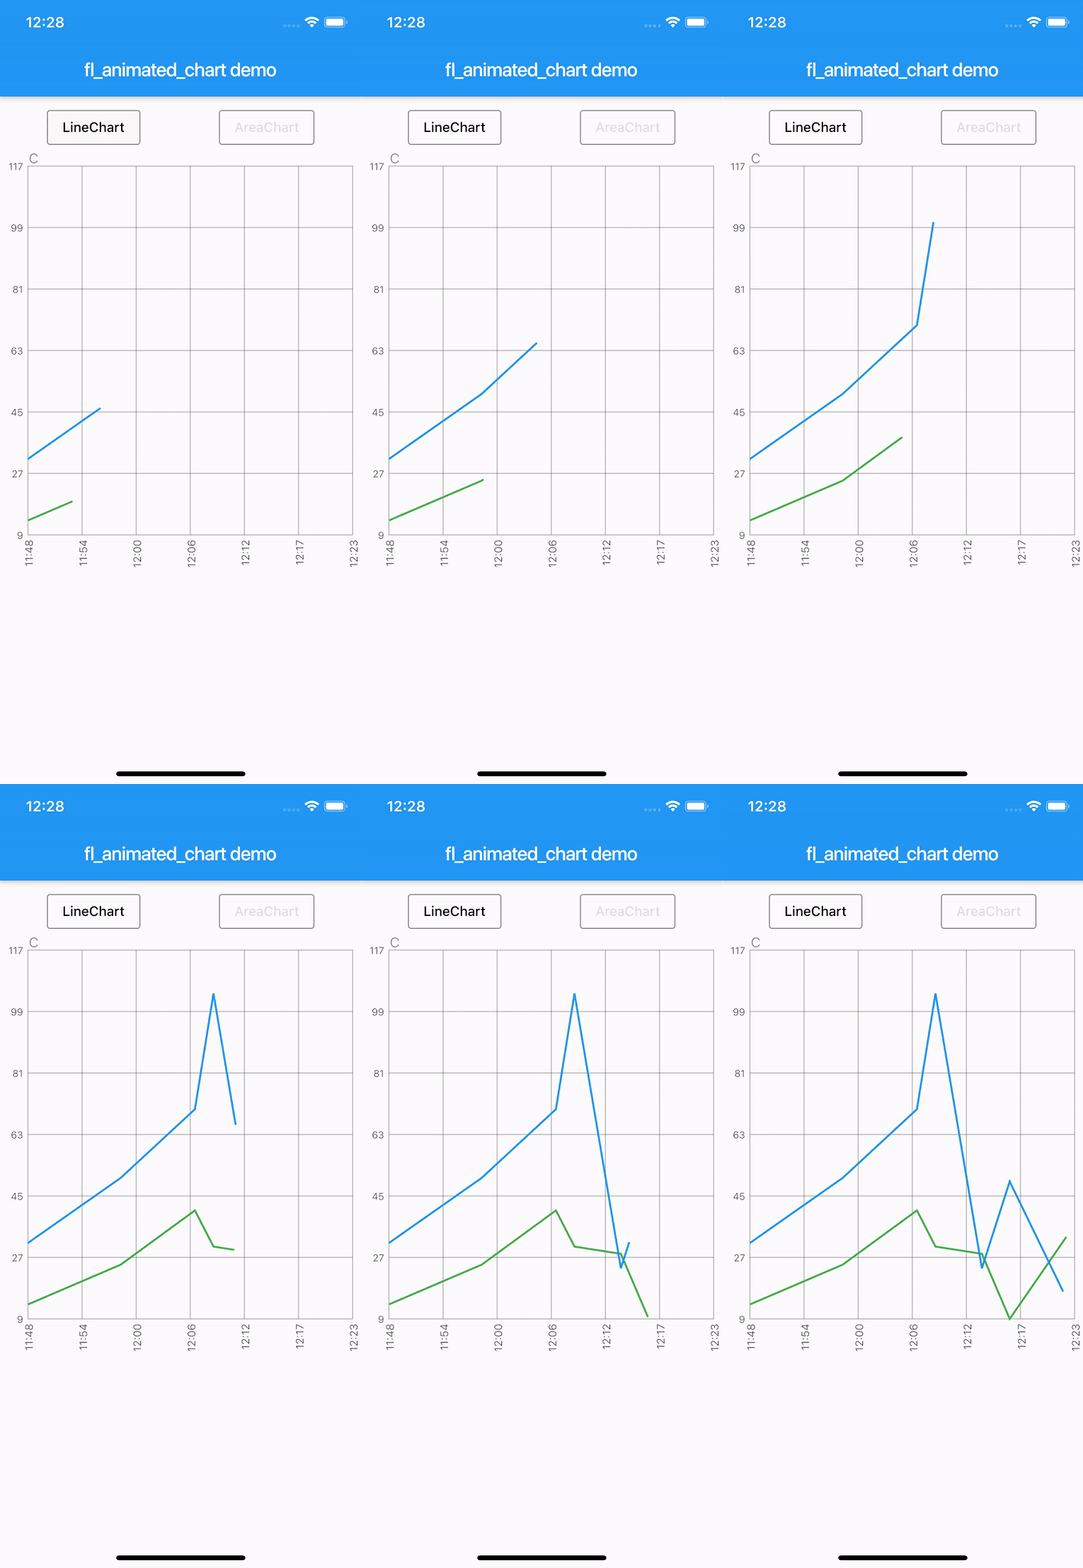
Animation of the chart
Possibility of adding legends
Support for both horizontal and vertical markerlines
Tested with more than 3000 points and still performing
There are currently two different charts:
line chart
area chart
Getting Started
Try the sample project or include in your project.
Highlight for the line chart:
Linechart with markerlines, icons, legends and "heat-map" shaded zones:
You can choose to either have a short line or an Icon as the first part of the legend before the title. It is possible set showLeadingLine to true, then a short line will be shown in the color you have defined.
You can change the Color of the line and Icon, and the TextStyle of the String title.
The length of the Legends list must to equal to the length of chartlines which have isMakerLine = true.
When orientation of the screen is in landscape mode, it is possible to have the legends drawn on the right hand side instead of below the graph.
Simply set legendsRightLandscapeMode: true
returnScaffold(
appBar: AppBar(
title: Text(widget.title),
),
body: Container(
child: Column(
mainAxisSize: MainAxisSize.max,
mainAxisAlignment: MainAxisAlignment.spaceBetween,
crossAxisAlignment: CrossAxisAlignment.stretch,
children: [
Expanded(
child: AnimatedLineChart(
lineChart,
toolTipColor: Colors.white,
gridColor: Colors.black54,
textStyle: TextStyle(fontSize: 10, color: Colors.black54),
showMarkerLines:
true, // If this value is not set to true, all defines lines will be filled lines and not dashed
legends: [
Legend(title: 'Critical', color: Colors.red, showLeadingLine: true),
Legend(title: 'Warning', color: Colors.yellow, Icon(Icons.report_problem_rounded, size: 17, color: Colors.yellow)),
],
legendsRightLandscapeMode: true,
),
),
],
),
),
);
Example code with horizontal and vertical markerlines along with icons on the chart and legends:
It is possible to define a maximum of two vertical markerlines.
The verticalMarker variable is a List<DateTime> and the length can be >= 2.
If two vertical markerlines are defined, the area between the two lines will be filled with a color that can be defined with verticalMarkerColor.
It is possible to add an Icon on the point where the vertical markerline crosses the y-axis value by defining the verticalMarkerIcon.
The verticalMarkerIcon variable takes a List<Icon> and the lenght must be equal to the length of the verticalMarker variable.
The possibility of adding a colored background to the icons have been added and can be defined with iconBackgroundColor which takes a Color.
returnScaffold(
appBar: AppBar(
title: Text(widget.title),
),
body: Container(
child: Column(
mainAxisSize: MainAxisSize.max,
mainAxisAlignment: MainAxisAlignment.spaceBetween,
crossAxisAlignment: CrossAxisAlignment.stretch,
children: [
Expanded(
child: AnimatedLineChart(
lineChart,
toolTipColor: Colors.white,
gridColor: Colors.black54,
textStyle: TextStyle(fontSize: 10, color: Colors.black54),
showMarkerLines:
true, // If this value is not set to true, all defines lines will be filled lines and not dashed
legends: [
Legend(title: 'Critical', color: Colors.red),
Legend(title: 'Warning', color: Colors.yellow),
],
verticalMarker:[
DateTime.parse('2012-02-27 12:54:00'),
DateTime.parse('2012-02-27 13:16:00')
],
verticalMarkerColor: Colors.yellow,
verticalMarkerIcon: [
Icon(
Icons.report_problem_rounded,
color: Colors.yellow,
),
Icon(
Icons.check_circle_rounded,
color: Colors.green,
),
],
iconBackgroundColor: Colors.white,
),
),
],
),
),
);
Example code with shaded area between markerlines:
It is possible to have shaded areas between the defined markerlines.
The shaded area will be in the same color as the markerline.
It is important that the order of enums in the List<MaxMin> filledMarkerLinesValues matches the order of defined markerlines to be shown in the graph.
Enums with the value MaxMin.MAX will draw to the top if there is only one markerline defined as MAX, otherwise it will draw from i - 1 where enum values are MAX.
If enum value is MaxMin.MIN the shaded area will draw downwards to i + 1, unless the index is the last in the list, then the shaded area will draw all the way to the bottom of the graph.