
Overview
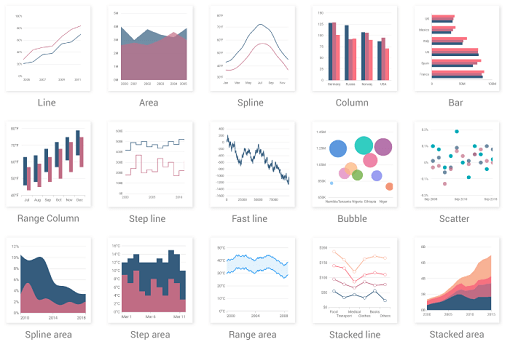
Syncfusion Flutter Charts is a comprehensive data visualization library for Flutter, offering a wide range of interactive and animated charts including cartesian and circular types. Designed for high performance and real-time updates, it enables developers to build dynamic, visually rich dashboards and reports across multiple platforms. The package supports extensive customization, touch interactions, and responsive layouts, making it ideal for applications requiring detailed data representation.
Use cases
- Real-time dashboards
- Data analytics interfaces
- Business reporting tools
- Interactive financial charts
- Educational data visualizations
Key features
- Support for 30+ chart types
- Real-time data streaming
- Touch and gesture support
- Customizable themes and animations
- Responsive design across devices
- Extensive data binding options
Suitable for
- Enterprise applications
- Data-driven apps
- Dashboard development
- Cross-platform charting needs
- High-performance visualization
Considerations
- Requires license for commercial use
- Larger package size due to extensive features
- Steeper learning curve for advanced features
- Limited community support compared to open-source alternatives
- Dependent on Syncfusion's ecosystem