
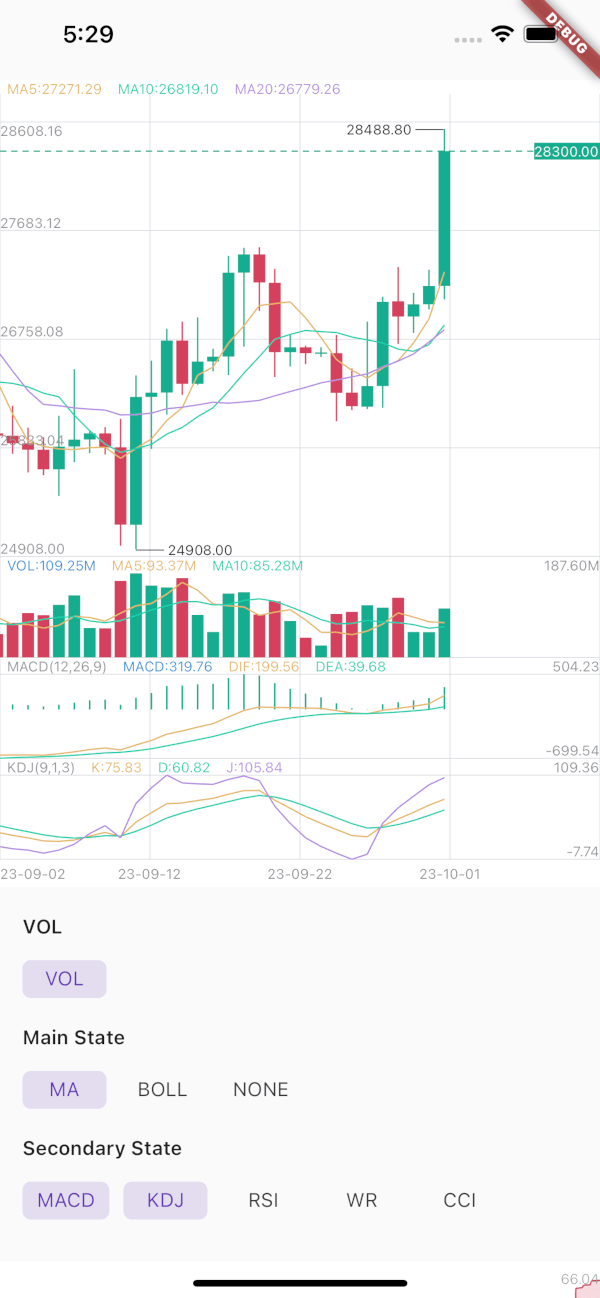
k_chart_plus is a Flutter library designed for building financial charts, including candlestick and depth charts tailored for exchange applications. It supports multi-state selection and offers smooth rendering across platforms. The package is ideal for trading interfaces requiring real-time data visualization and interactive chart features. With support for Android, iOS, Web, macOS, Windows, and Linux, it ensures consistent performance across devices. Its lightweight design and customizable components make it suitable for developers focused on finance or cryptocurrency apps.
Use cases
- Trading platform dashboards
- Cryptocurrency price tracking
- Real-time market data visualization
- Exchange application interfaces
- Interactive chart analysis
Key features
- Candlestick chart support
- Depth chart visualization
- Multi-state selection
- Cross-platform compatibility
- Customizable chart themes
- Smooth animation rendering
Suitable for
- Finance app developers
- Crypto exchange builders
- Real-time data visualization projects
- Mobile and web trading apps
- UI-focused chart implementations
Considerations
- Requires knowledge of financial charting concepts
- Best suited for high-frequency data updates
- Limited to specific chart types
- May need additional state management for complex interactions
- Not ideal for non-financial data visualizations