
Overview
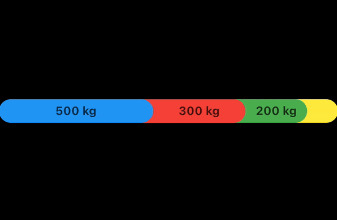
A Flutter package for visualizing multiple data values on a vertical bar chart using animated progress indicators. It enables smooth, dynamic rendering of data with customizable styling and transitions. Ideal for dashboards, performance tracking, or any scenario requiring intuitive, real-time data representation. The package supports all major platforms including mobile, web, and desktop, ensuring consistent behavior across devices.
Use cases
- Real-time data dashboards
- Performance monitoring
- User progress tracking
- Comparative data visualization
- Interactive reports
Key features
- Animated progress bars
- Vertical layout
- Multiple data series support
- Customizable colors and styles
- Cross-platform compatibility
Suitable for
- Developers building data visualization features
- Apps requiring user progress indicators
- Dashboards with dynamic metrics
- Educational or fitness applications
Considerations
- Best suited for moderate data sets
- Limited to bar-style visualization
- Requires careful design for dense data
- Not ideal for complex statistical charts