
Overview
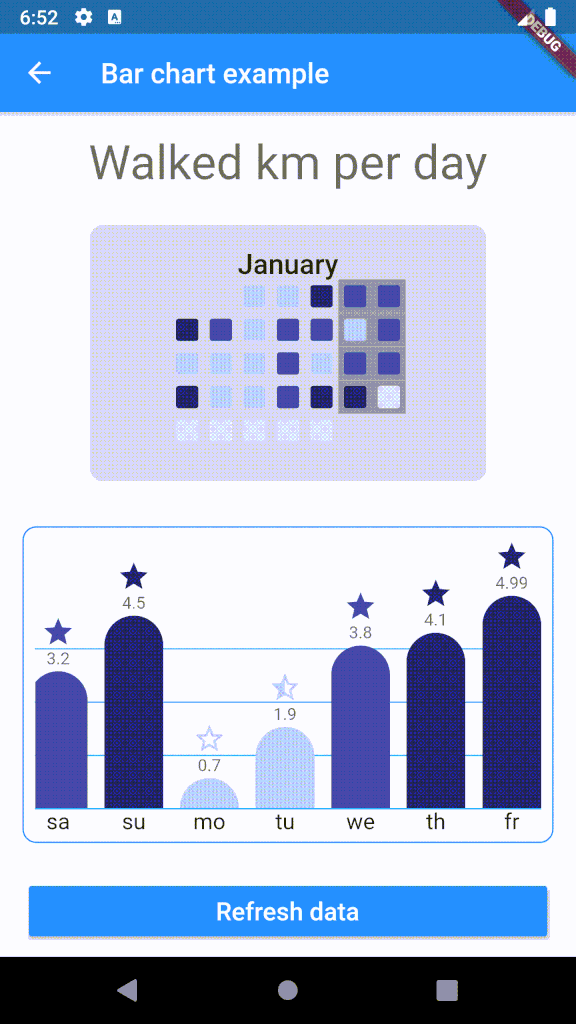
chart_components is a Flutter package offering two animated chart widgets: an animated bar chart and an animated calendar grid chart inspired by GitHub's visualization style. Designed for data representation, it provides extensive customization options through numerous configurable properties. The components are ideal for displaying time-series data or performance metrics with smooth animations. Built with Flutter's rendering engine, it ensures responsive and visually appealing charts suitable for dashboards and analytics interfaces.
Use cases
- Displaying time-series data
- Visualizing performance metrics
- Creating dashboard widgets
- Building analytics interfaces
- Showing activity trends
- Enhancing data presentation in apps
Key features
- Animated bar chart
- Animated calendar grid chart
- Extensive customization options
- Smooth animations
- GitHub-inspired design
- Responsive layout
Suitable for
- Data visualization apps
- Dashboard development
- Analytics tools
- Activity tracking features
- Flutter developers seeking reusable charts
Considerations
- Limited to two chart types
- No built-in data transformation
- Requires manual data handling
- Not optimized for large datasets
- No server-side rendering support
- Depends on external source code