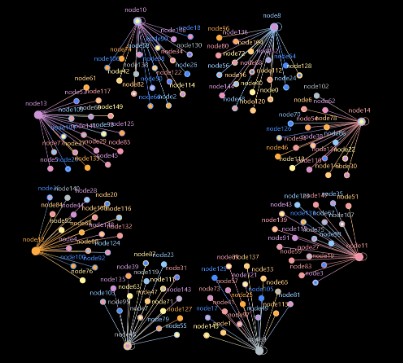
Original README snapshot from the linked source repository. Visit the repository for the latest content.
Flutter Graph View
Widgets for beautiful graphic data structures, such as force-oriented diagrams.
https://github.com/graph-cn/flutter_graph_view/assets/15630211/a035cd7d-bdac-4ef6-8abf-74594e9d699b
Features
[x] Data converter: convert business data into graphic view data.
[x] Algorithm: calculate vertex layout.
[x] Force directed algorithm.
[x] Random algorithm (In example folder).
[x] Support algorithm decorator.
[x] Breathe decorator (optional).
[x] Provide decorators that follow Hooke's Law for related nodes
[x] Provide a decorator for Hooke's Law from the center outward for all nodes
[x] Provide mutually exclusive Coulomb's law decorators for subgraph root nodes
[x] Hooke's Law decorator that provides border buffering collisions for all nodes
[x] Add a counter decorator in the figure to convert node forces into motion
[x] Data panel embedding.
[x] Style configuration.
[ ] More graphical interactions.
Getting started
flutter pub add flutter_graph_view
Usage
import 'dart:math' ;
import 'package:flutter/material.dart' ;
import 'package:flutter_graph_view/flutter_graph_view.dart' ;
class DecoratorDemo extends StatelessWidget const DecoratorDemo ({super .key});
@override
Widget build (BuildContext context) {
var vertexes = <Map >{};
var r = Random ();
for (var i = 0 ; i < 150 ; i++) {
vertexes.add (
{
'id' : 'node$i ' ,
'tag' : 'tag${r.nextInt(9 )} ' ,
'tags' : [
'tag${r.nextInt(9 )} ' ,
if (r.nextBool ()) 'tag${r.nextInt(4 )} ' ,
if (r.nextBool ()) 'tag${r.nextInt(8 )} '
],
},
);
}
var edges = <Map >{};
for (var i = 0 ; i < 150 ; i++) {
edges.add ({
'srcId' : 'node${i % 8 + 8 } ' ,
'dstId' : 'node$i ' ,
'edgeName' : 'edge${r.nextInt(3 )} ' ,
'ranking' : DateTime .now ().millisecond,
});
}
var data = {
'vertexes' : vertexes,
'edges' : edges,
};
return FlutterGraphWidget (
data: data,
algorithm: RandomAlgorithm (
decorators: [
CoulombDecorator (),
HookeDecorator (),
CoulombCenterDecorator (),
HookeCenterDecorator (),
ForceDecorator (),
ForceMotionDecorator (),
TimeCounterDecorator (),
],
),
convertor: MapConvertor (),
options: Options ()
..enableHit = false
..panelDelay = const Duration (milliseconds: 500 )
..graphStyle = (GraphStyle ()
..tagColor = {'tag8' : Colors .orangeAccent.shade200}
..tagColorByIndex = [
Colors .red.shade200,
Colors .orange.shade200,
Colors .yellow.shade200,
Colors .green.shade200,
Colors .blue.shade200,
Colors .blueAccent.shade200,
Colors .purple.shade200,
Colors .pink.shade200,
Colors .blueGrey.shade200,
Colors .deepOrange.shade200,
])
..useLegend = true
..edgePanelBuilder = edgePanelBuilder
..vertexPanelBuilder = vertexPanelBuilder
..edgeShape = EdgeLineShape ()
..vertexShape = VertexCircleShape (),
);
}
Widget edgePanelBuilder (Edge edge, Viewfinder viewfinder) {
var c = viewfinder.localToGlobal (edge.position);
return Stack (
children: [
Positioned (
left: c.x + 5 ,
top: c.y,
child: SizedBox (
width: 200 ,
child: ColoredBox (
color: Colors .grey.shade900.withAlpha (200 ),
child: ListTile (
title: Text (
'${edge.edgeName} @${edge.ranking} \nDelay controlled by \noptions.panelDelay\ndefault to 300ms' ),
),
),
),
)
],
);
}
Widget vertexPanelBuilder (hoverVertex, Viewfinder viewfinder) {
var c = viewfinder.localToGlobal (hoverVertex.cpn!.position);
return Stack (
children: [
Positioned (
left: c.x + hoverVertex.radius + 5 ,
top: c.y - 20 ,
child: SizedBox (
width: 120 ,
child: ColoredBox (
color: Colors .grey.shade900.withAlpha (200 ),
child: ListTile (
title: Text (
'Id: ${hoverVertex.id} ' ,
),
subtitle: Text (
'Tag: ${hoverVertex.data['tag' ]} \nDegree: ${hoverVertex.degree} ${hoverVertex.prevVertex?.id} ' ),
),
),
),
)
],
);
}
}
Licence
flutter_graph_view is under the Apache License, Version 2.0 .