Package selection guidance compiled from public package information, community data, and project usage.
A Flutter library for creating customizable, scrollable stacked bar charts. Designed for developers who need flexible visualization tools, it supports dynamic data rendering across multiple platforms including Android, iOS, Web, macOS, Windows, and Linux. The package enables intuitive data representation with smooth scrolling and extensive styling options to match app design needs. Ideal for dashboards, analytics, and reporting interfaces where layered data comparison is essential.
Use cases
Data dashboards
Analytics reporting
Financial trend visualization
Educational apps
Inventory tracking
Performance monitoring
Key features
Scrollable charts
Customizable colors and styles
Multi-layered bar visualization
Responsive design
Platform-agnostic support
Dynamic data updates
Suitable for
Developers building data-heavy apps
UI designers needing interactive charts
Teams working on cross-platform projects
Analytics-focused applications
Real-time data visualization
Considerations
Requires understanding of chart data structures
May need additional state management for complex interactions
Performance impact with very large datasets
Limited built-in tooltips or annotations
Custom styling may require additional code
Original README
Original README snapshot from the linked source repository. Visit the repository for the latest content.
stacked_bar_chart
A Flutter package for creating different types of charts.This package gives developer the flexibility to customize their graph as well.
Features
Plot graphs
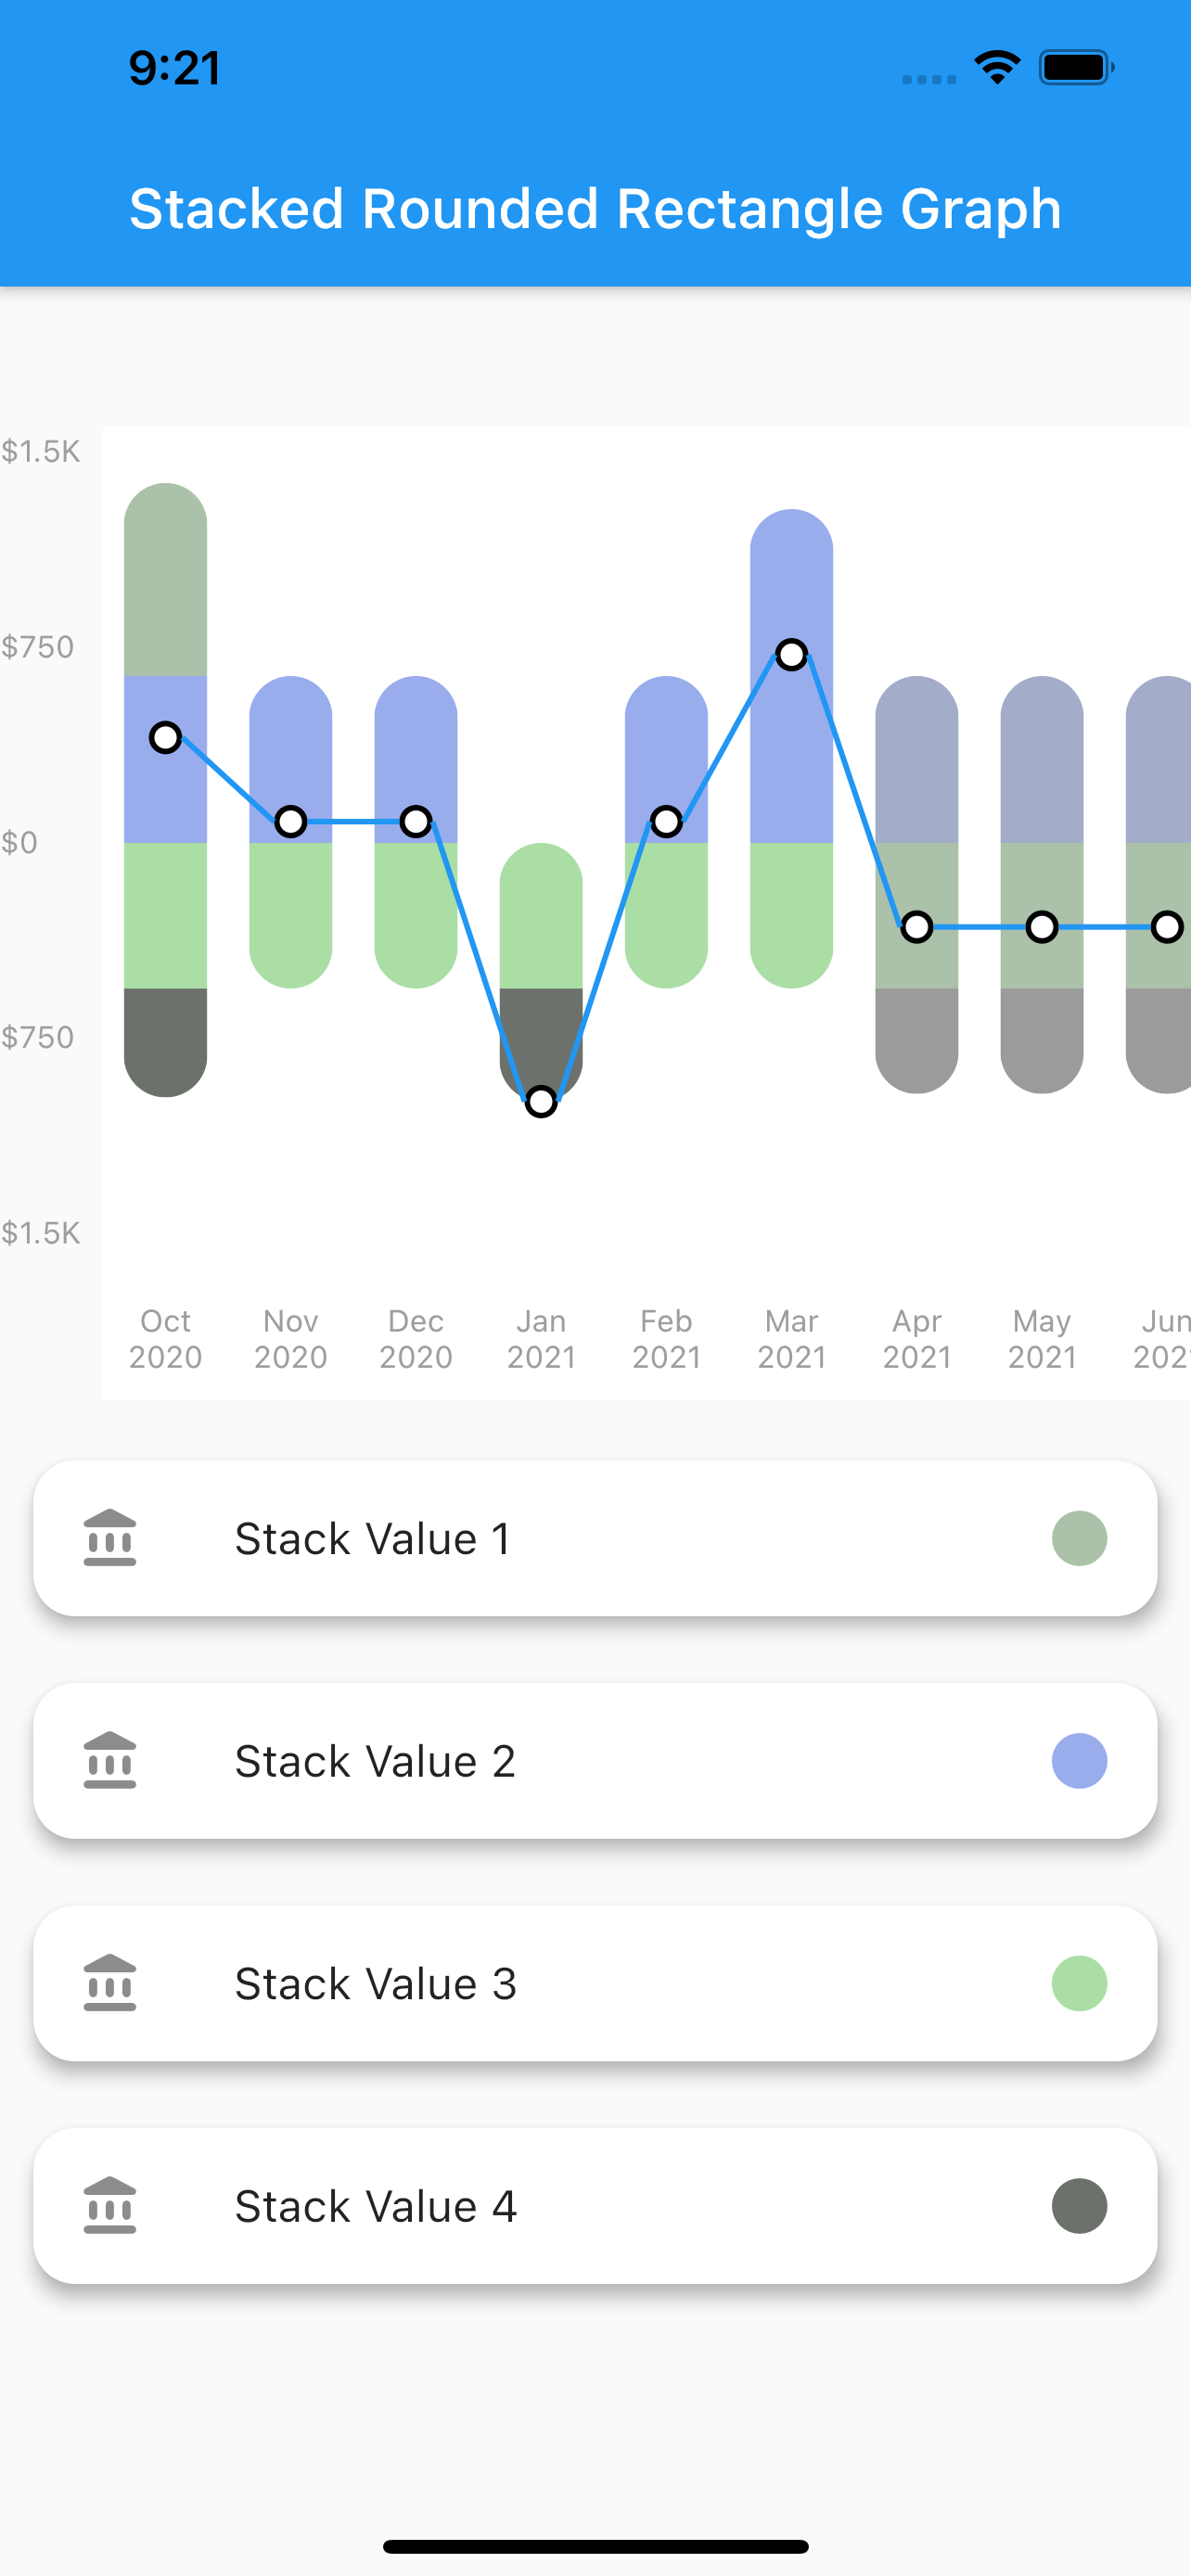
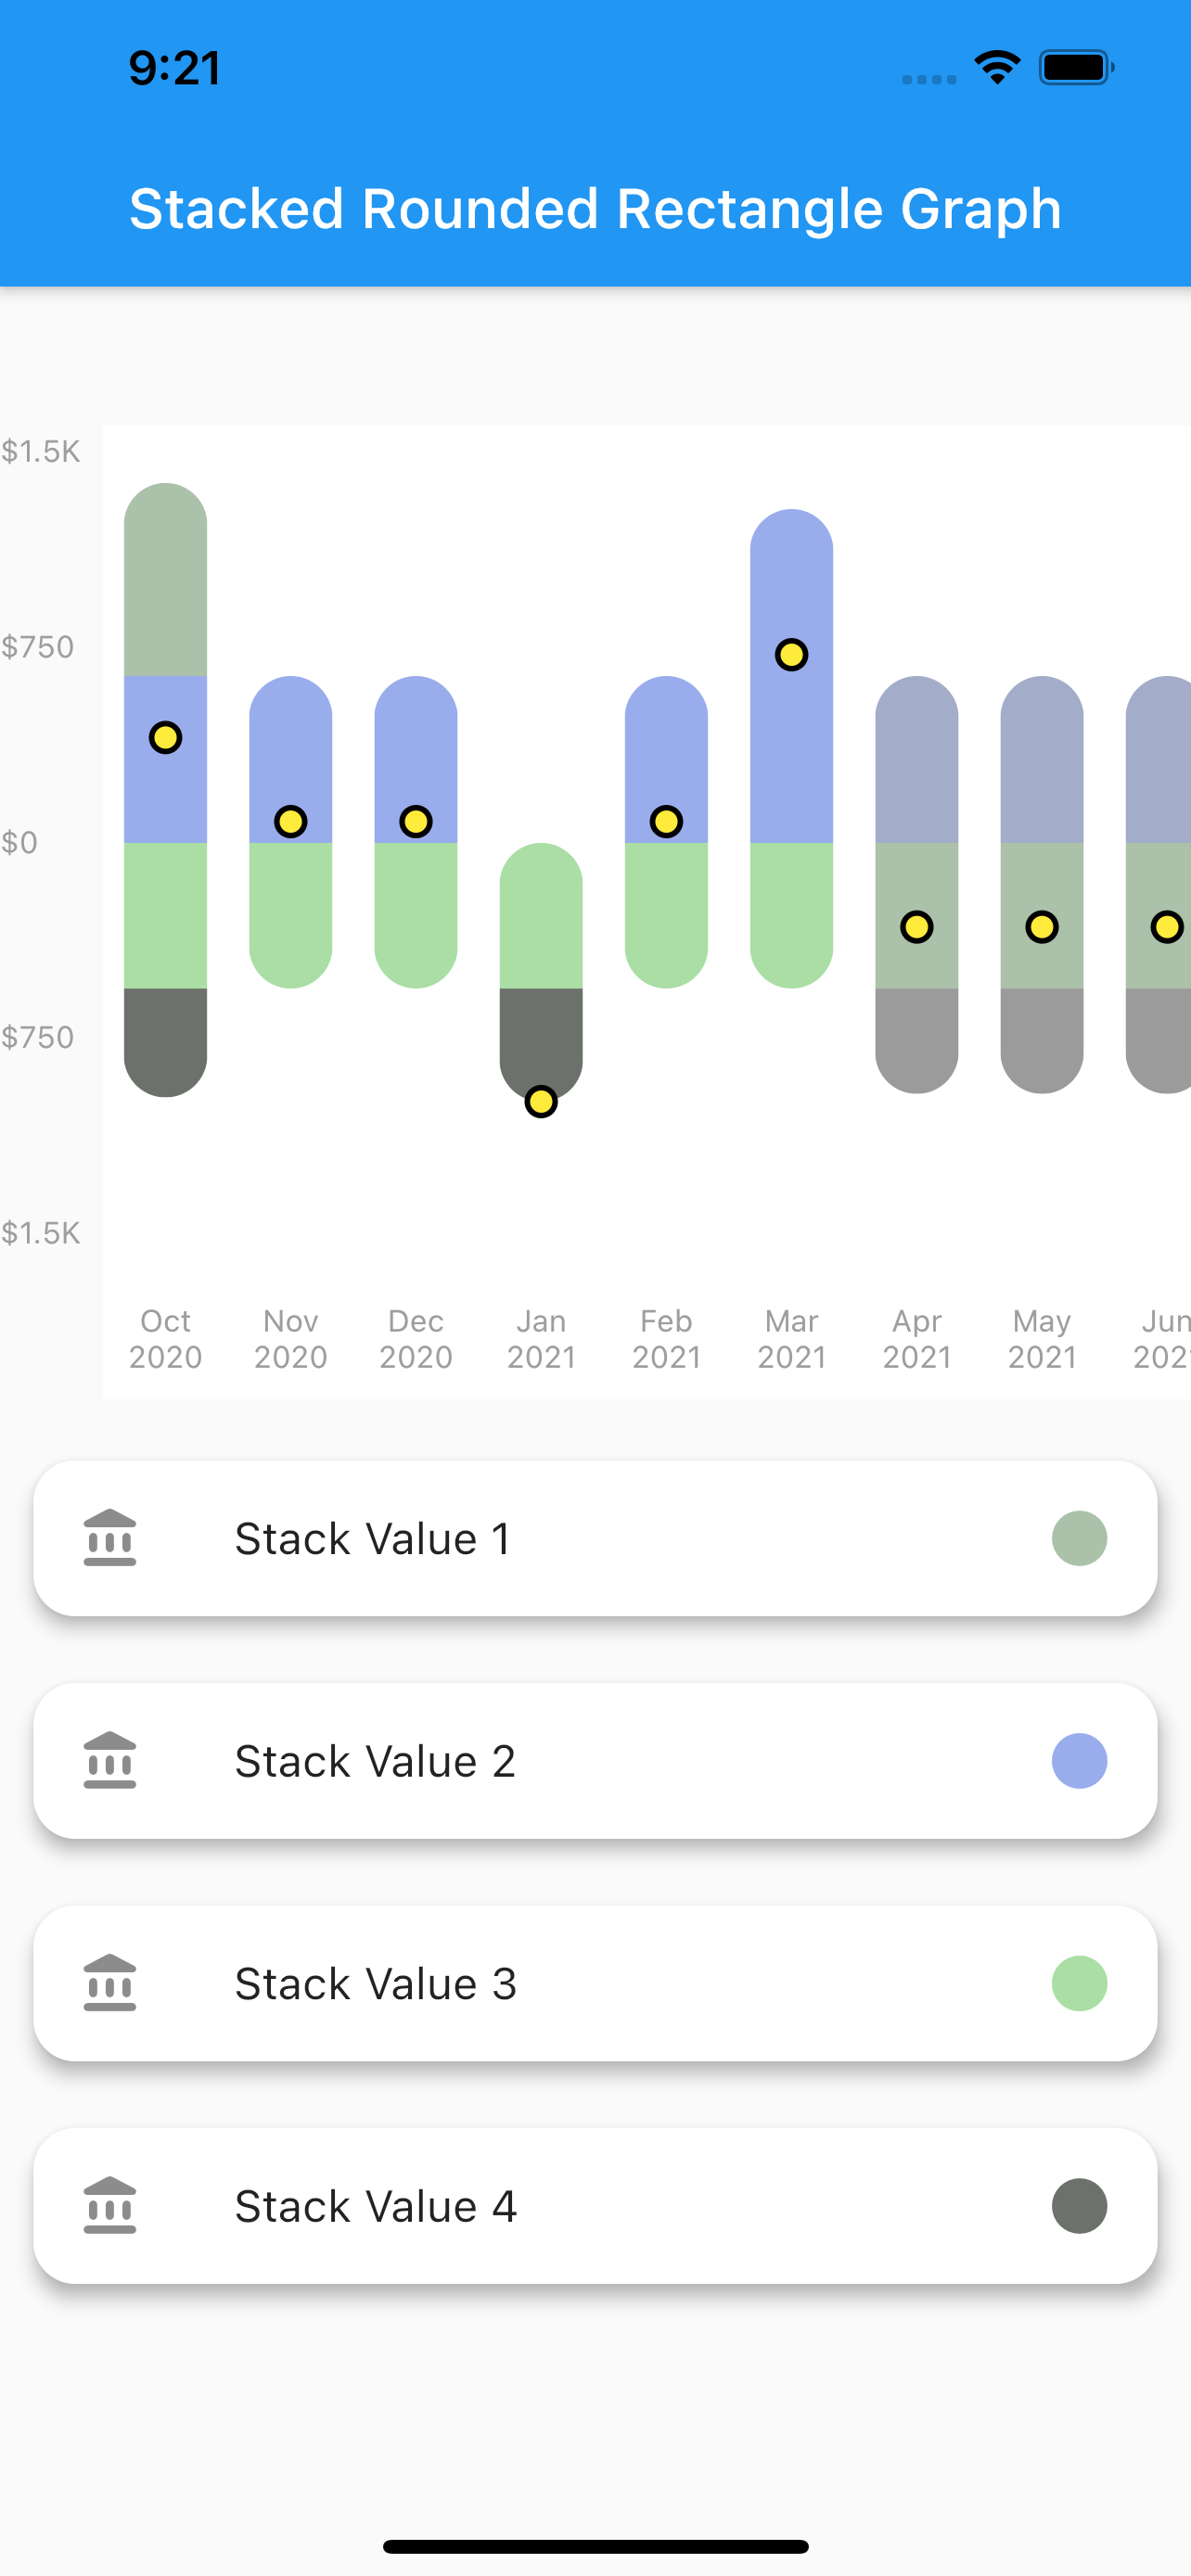
Stacked Rounded Rectangle Graph
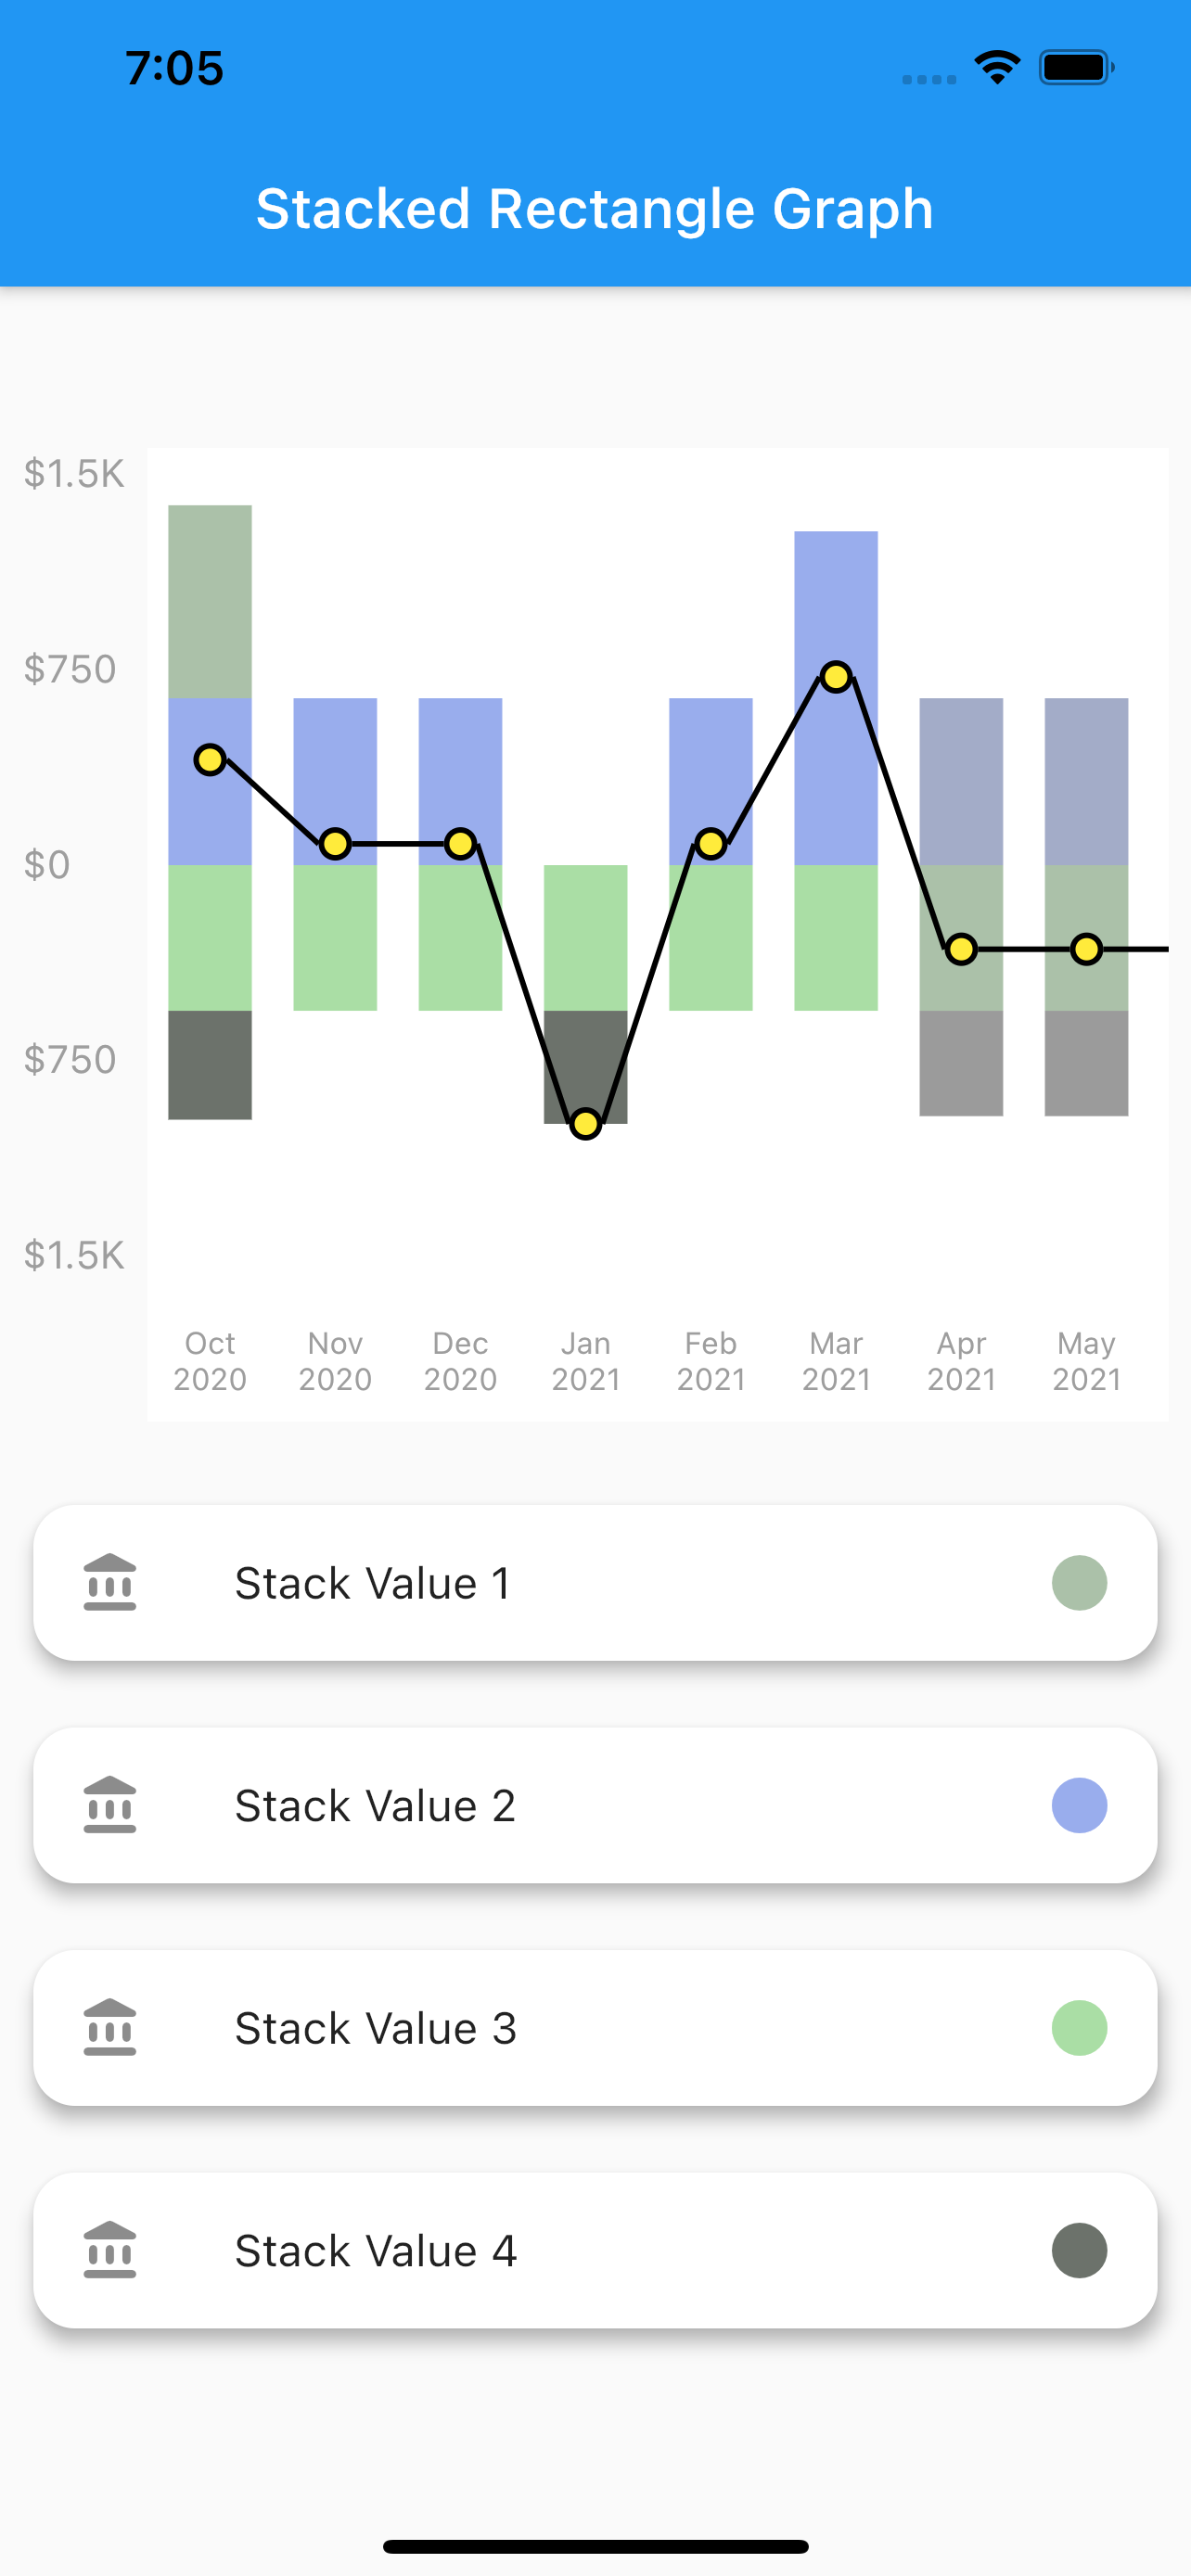
Stacked Rectangele Graph
Net Line Graph
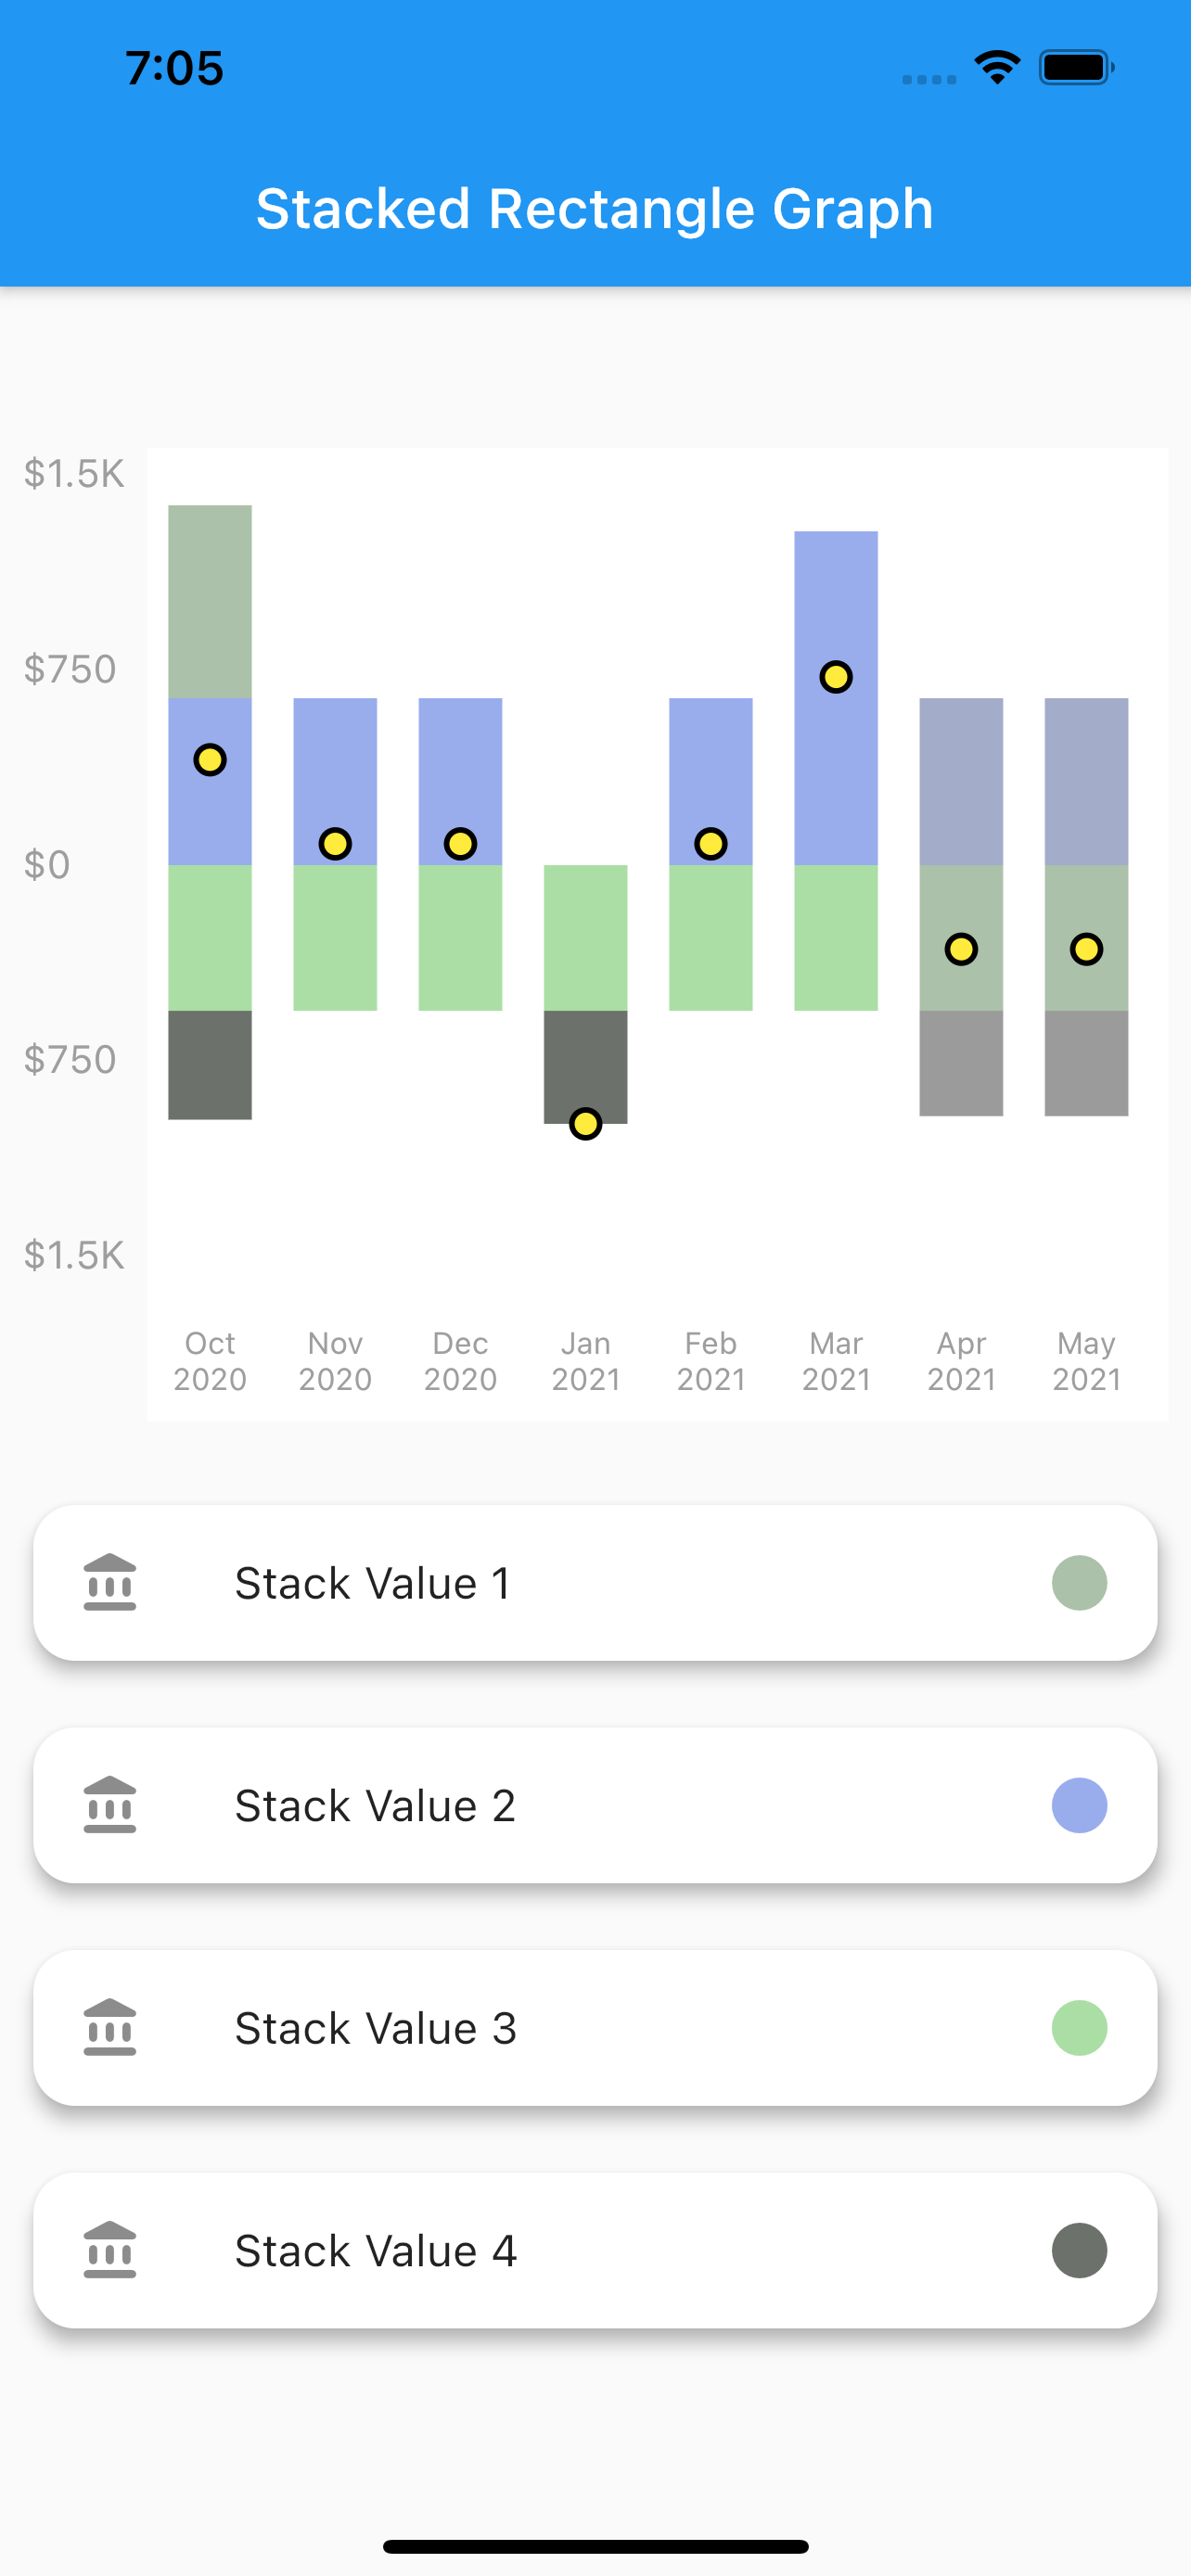
Net Point Graph
Customize your graph
Select if you want to display the net line
change core color,line color as well as line width of the net line
Scrollable
The graphs plotted are scrollable
Provide data in json format
You can use the toMap() and forMap() methods to provide your data in json format
Style your Labels
You can style both you X-axis and Y-axis Labels.
Callback on bar tap
A callback is provided on tap of each bar. Developer can use this feature as per their need.
Installation
In the dependencies: section of your pubspec.yaml, add the following line:
A simple stacked bar graph with no rounded borders. You can customize it in the same way as the stacked rounded rectangle graph.
To plot this graph pass the GraphType.StackedRect in graphType. as shown below
graphType: GraphType.StackedRect
3. Net Line Graph
A simple line graph plotted with the net values of the data provided. The net values of a particular data is calculated and plotted.It can also be customized in the same way as stacked rounded rectangle graph.
To plot this graph pass the GraphType.StackedRect in graphType. as shown below
graphType: GraphType.LineGraph
4. Net Point Graph
A simple plot of the net values of the data.You can customize the point core and it's outer border using the netPoint parameter.
To plot this graph pass the GraphType.StackedRect in graphType. and then pass parameters in netLine to remove the line as shown below