Search packages, repositories and app categories

Package detailsv0.1.19

modern_charts

A package for creating simple yet modern looking charts.

30-day downloads
53
Likes
45
Pub points
30

Install package

flutter pub add modern_charts

Package Overview

Package selection guidance compiled from public package information, community data, and project usage.

modern_charts is a Flutter package designed to create clean, modern-looking charts with minimal setup. It provides a simple API for rendering visualizations like line, bar, and pie charts, emphasizing aesthetics and ease of integration. The package focuses on delivering visually appealing charts without requiring extensive configuration, making it ideal for apps that need polished data representation. Built with Flutter's rendering capabilities, it ensures smooth performance and responsive design across devices.

Use cases

  • Displaying app analytics
  • Visualizing user activity over time
  • Presenting sales or revenue trends
  • Enhancing dashboard interfaces
  • Creating lightweight data summaries

Key features

  • Modern, minimalist design
  • Simple API for quick implementation
  • Support for common chart types
  • Responsive layout adaptation
  • Customizable colors and themes

Suitable for

  • Developers seeking fast chart integration
  • Apps with data visualization needs
  • Design-focused applications
  • Prototyping interactive dashboards
  • Projects prioritizing visual appeal

Considerations

  • Limited advanced customization options
  • No built-in interactivity like tooltips
  • Best suited for basic charting needs
  • Not ideal for complex or highly dynamic data
  • Depends on external styling for advanced features
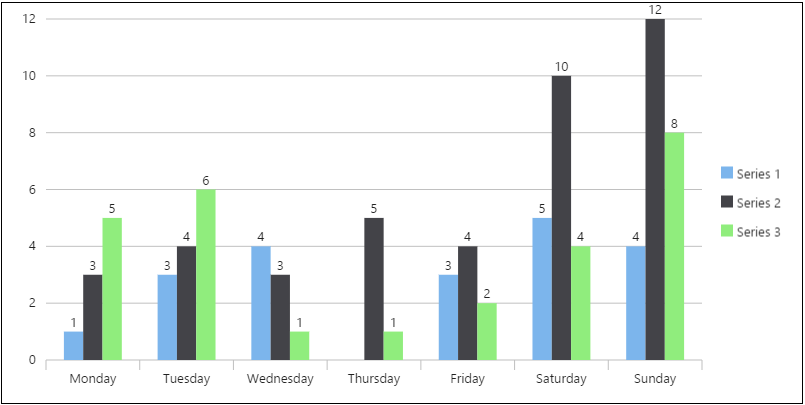
Original README

Original README snapshot from the linked source repository. Visit the repository for the latest content.

A package for creating simple yet modern looking charts.

Five chart types
  • Bar

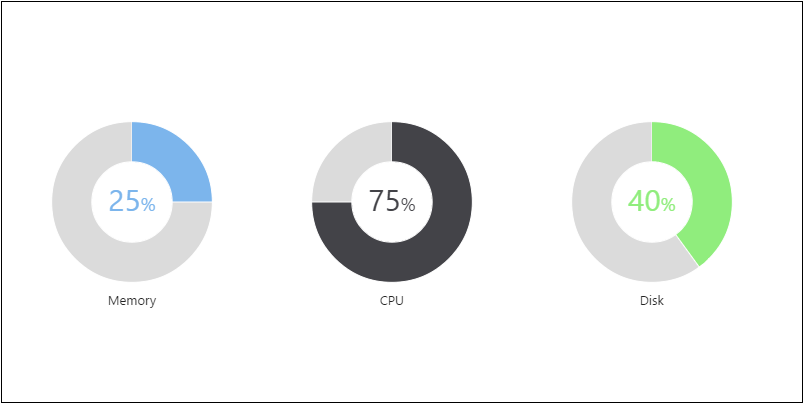
  • Gauge

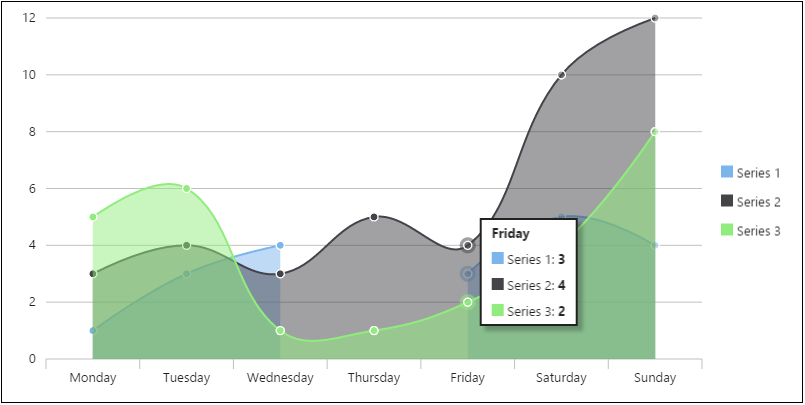
  • Line

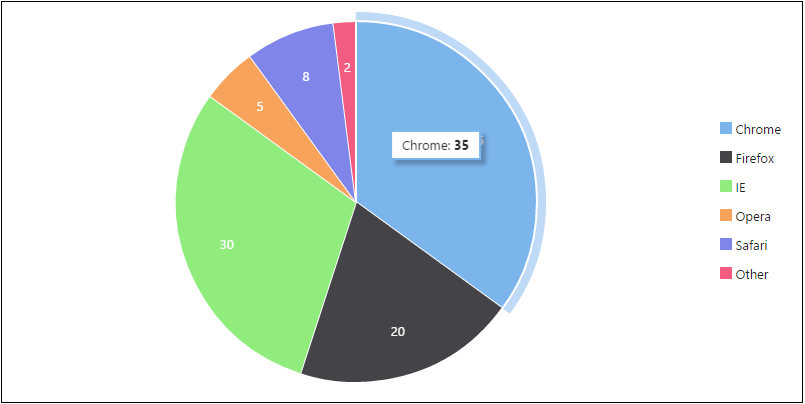
  • Pie

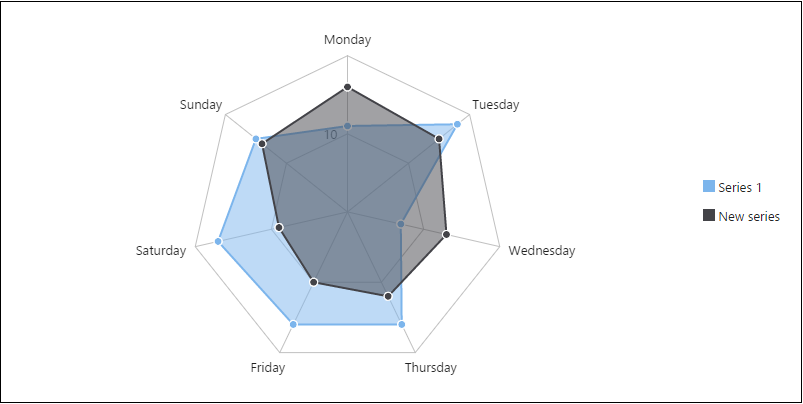
  • Radar

Canvas + DOM

modern_charts combines Canvas and DOM to achieve the best performance and experience.

  • Canvas is used to render chart contents (axes, grids, and series)
  • DOM is used to create legends and tooltips
DataTable

Data are passed to a chart via a DataTable object. By using DataTable, you can flexibly modify the data even after the chart has been rendered.

Animations

Animations are supported for different types of data modifications:

  • New data table
  • Changes to data table values
  • Insertion and removal of rows (categories)
  • Insertion and removal of columns (series)
  • Series visibility toggle
Responsive

Charts automatically resize when the browser is resized.

Interactive
  • Shows tooltips on hover/tap
  • The visibility of a series is toggled when you click the corresponding legend item
Modular

Each chart type has its own class, so your final production code only contains the code of the chart types you use.

Usage

Please read the wiki for instructions on how to use these beautiful charts.

Categories

Dependencies

Dependency list 1 items

Source repository

Projects using this package

No data available yet.