

v0.1.19
modern_charts
A package for creating simple yet modern looking charts.
45Likes 5330-day downloads30Pub points
Platforms unavailable
jolleekin/modern_charts open-source repository details.

English project snapshot. Visit GitHub for the latest content.
A package for creating simple yet modern looking charts.
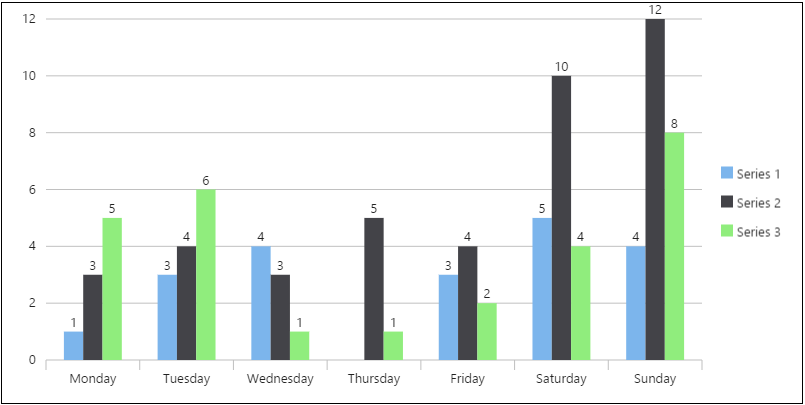
Bar
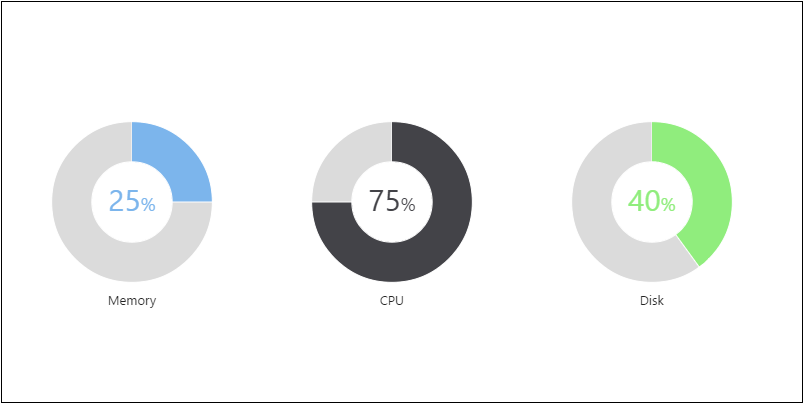
Gauge
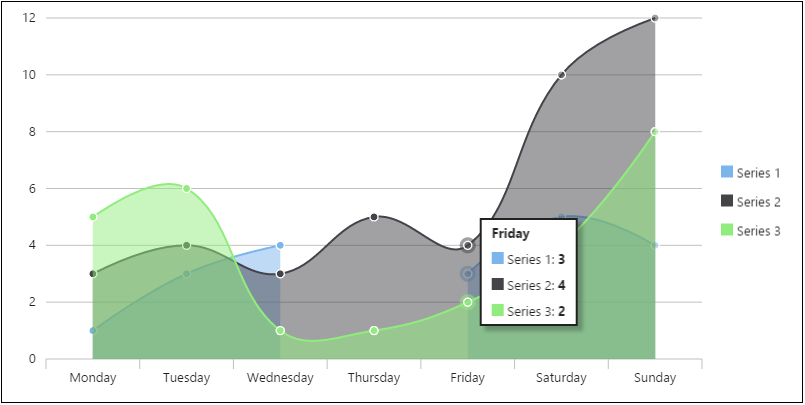
Line
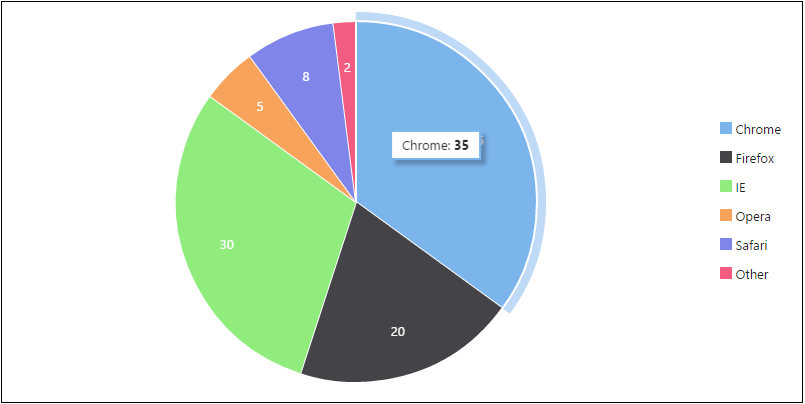
Pie
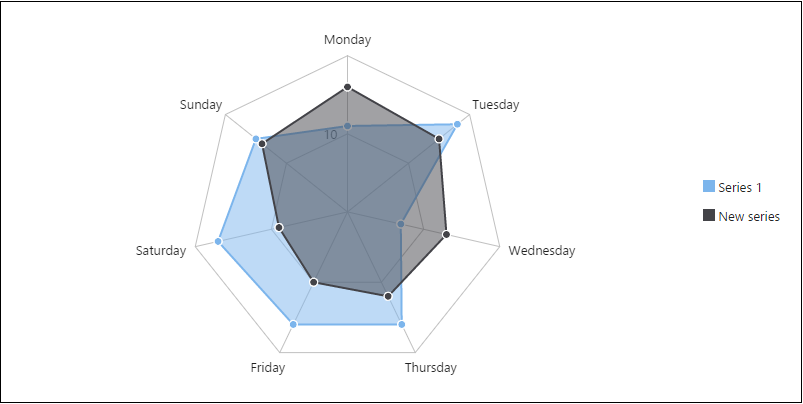
Radar
modern_charts combines Canvas and DOM to achieve the best performance and experience.
Data are passed to a chart via a DataTable object. By using DataTable, you
can flexibly modify the data even after the chart has been rendered.
Animations are supported for different types of data modifications:
Charts automatically resize when the browser is resized.
Each chart type has its own class, so your final production code only contains the code of the chart types you use.
Please read the wiki for instructions on how to use these beautiful charts.
Dependency list 4 items
>=0.15.7anyanyanyStart with your use case, compare repository activity, and check the original project before adopting it.
“A repository is the most basic element of GitHub.”
GitHub Docs — About repositories ↗