Search packages, repositories and app categories

chart_sparkline cover
Package detailsv1.1.2

chart_sparkline

Beautiful sparkline charts for Flutter.Average line, highest and lowest value.

AndroidiOSWebmacOSWindowsLinux
30-day downloads
7.5K
Likes
135
Pub points
150

Install package

flutter pub add chart_sparkline

Package Overview

Package selection guidance compiled from public package information, community data, and project usage.

Chart Sparkline is a Flutter package that enables the creation of compact, visually appealing sparkline charts. It displays trends in small spaces with features like average lines, and highlights maximum and minimum values. Ideal for dashboards and data summaries, it supports multiple platforms including Android, iOS, Web, macOS, Windows, and Linux. The package is lightweight and integrates seamlessly into existing Flutter apps. Its clean design enhances data readability without overwhelming users.

Use cases

  • Dashboard widgets
  • Real-time data tracking
  • Performance trend visualization
  • Compact data summaries
  • Financial metric displays

Key features

  • Average line visualization
  • Highlight max and min values
  • Minimalist design
  • Cross-platform support
  • Easy integration with Flutter
  • Smooth rendering

Suitable for

  • Data dashboards
  • Mobile and web applications
  • Analytics interfaces
  • Financial and health tracking apps
  • UIs requiring compact charts

Considerations

  • Best for small datasets
  • Limited interactivity
  • No tooltips or labels
  • Requires manual data formatting
  • Not suitable for complex chart types

Original README

Original README snapshot from the linked source repository. Visit the repository for the latest content.

pub package

chart_sparkline

Beautiful sparkline charts for Flutter.

screenshot

Online Demo

Online Demo

Installation

Install the latest version from pub.

Quick Start

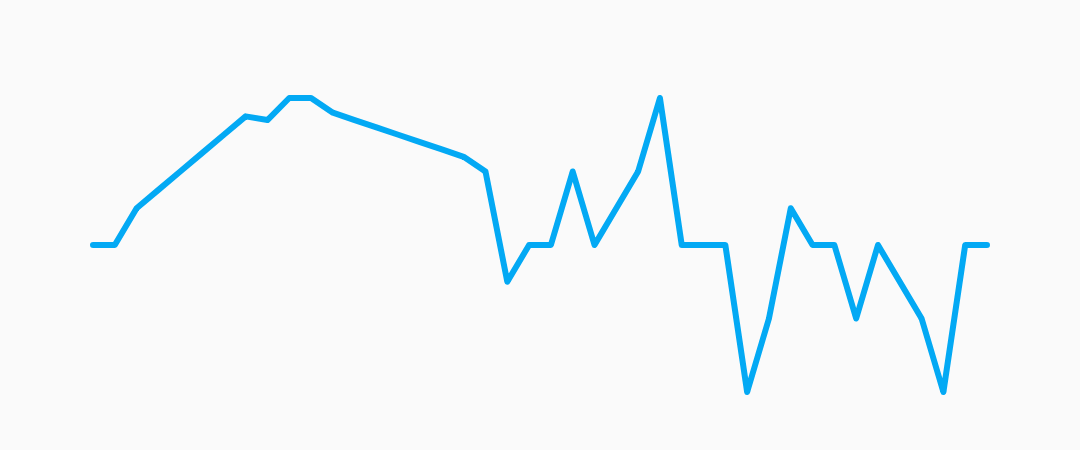
Import the package, create a Sparkline , and pass it your data.

import 'package:flutter/material.dart';
import 'package:chart_sparkline/chart_sparkline.dart';

void main() {
  var data = [0.0, 1.0, 1.5, 2.0, 0.0, 0.0, -0.5, -1.0, -0.5, 0.0, 0.0];
  runApp(
    MaterialApp(
      home: Scaffold(
        body: Center(
          child: Container(
            width: 300.0,
            height: 100.0,
            child: Sparkline(
              data: data,
            ),
          ),
        ),
      ),
    ),
  );
}

base example screenshot

Customization

Sparkline
Property Default
lineWidth 2.0
lineColor Colors.lightBlue
lineGradient null

Example:

Sparkline(
  data: data,
  lineWidth: 5.0,
  lineColor: Colors.purple,
);

lineopts example screenshot

Sparkline(
  data: data,
  lineWidth: 10.0,
  lineGradient: LinearGradient(
    begin: Alignment.topCenter,
    end: Alignment.bottomCenter,
    colors: [Colors.purple[800], Colors.purple[200]],
  ),
);

lineopts example screenshot


Points
Property Default
pointsMode PointsMode.none
pointSize 4.0
pointColor Colors.lightBlue[800]
pointIndex null
PointsMode Description
none (default) Do not draw individual points.
all Draw all the points in the data set.
last Draw only the last point in the data set.
atIndex Draw one point at the index specified by pointIndex.

Example:

Sparkline(
  data: data,
  pointsMode: PointsMode.all,
  pointSize: 8.0,
  pointColor: Colors.amber,
);

all points example screenshot

Sparkline(
  data: data,
  pointsMode: PointsMode.last,
  pointSize: 8.0,
  pointColor: Colors.amber,
);

last point example screenshot

Sparkline(
  data: data,
  pointsMode: PointsMode.atIndex,
  pointIndex: 7,
  pointSize: 8.0,
  pointColor: Colors.amber,
);

Fill
Property Default
fillMode FillMode.none
fillColor Colors.lightBlue[200]
fillGradient null
FillMode Description
none (default) Do not fill, draw only the sparkline.
above Fill the area above the sparkline.
below Fill the area below the sparkline.

Example:

Sparkline(
  data: data,
  fillMode: FillMode.below,
  fillColor: Colors.red[200],
);

fill below example screenshot

Sparkline(
  data: data,
  fillMode: FillMode.above,
  fillColor: Colors.red[200],
);

fill above example screenshot

Sparkline(
  data: data,
  fillMode: FillMode.below,
  fillGradient: LinearGradient(
    begin: Alignment.topCenter,
    end: Alignment.bottomCenter,
    colors: [Colors.red[800], Colors.red[200]],
  ),
);

fill above example screenshot

Smoothing
Sparkline(
  data: data,
  useCubicSmoothing: true,
  cubicSmoothingFactor: 0.2,
),

cubic smoothing example screenshot

Average Line
Sparkline(
  data: data,
  averageLine: true,
  averageLabel: true,
),

cubic smoothing example screenshot

first, last, highest and the lowest
Sparkline(
  data: data,
  kLine: ['max', 'min', 'first', 'last'],
),

cubic smoothing example screenshot

Grid Line
Sparkline(
  gridLinelabelPrefix: '\$',
  gridLineLabelPrecision: 3,
  enableGridLines: true,
),

cubic smoothing example screenshot

Animation Line

Online Demo

AnimatedBuilder(
  animation: AnimationController(duration: const Duration(seconds: 1), vsync: this),
  builder: (context, child) => Sparkline(
    data: [0.0, 1.0, 1.5, 2.0, 0.0, 0.0, -0.5, -1.0, -0.5, 0.0, 0.0],
    animationController: _controller,
    pointsMode: PointsMode.all,
    pointSize: 8.0,
  ),
),

Todo:
  • [x] simple sparkline
  • [x] custom line width
  • [x] custom line color
  • [x] optional rounded corners
  • [x] fill
  • [x] embiggen individual points/change color
  • [x] different points modes [all/last/none]
  • [ ] animate between two sparklines
  • [x] animate drawing a single sparkline
  • [ ] gesture detector to select closest point to tap
  • [x] baseline
  • [x] different fill modes [above/below/none]
  • [x] fix edge points overflowing by offsetting by lineWidth
  • [x] better corner rounding
  • [x] axis labels
  • [x] gradient shader on line paint
  • [x] gradient shader on fill paint
  • [ ] multiple overlapping sparklines on a shared axis

Categories

Source repository

Projects using this package

No data available yet.