
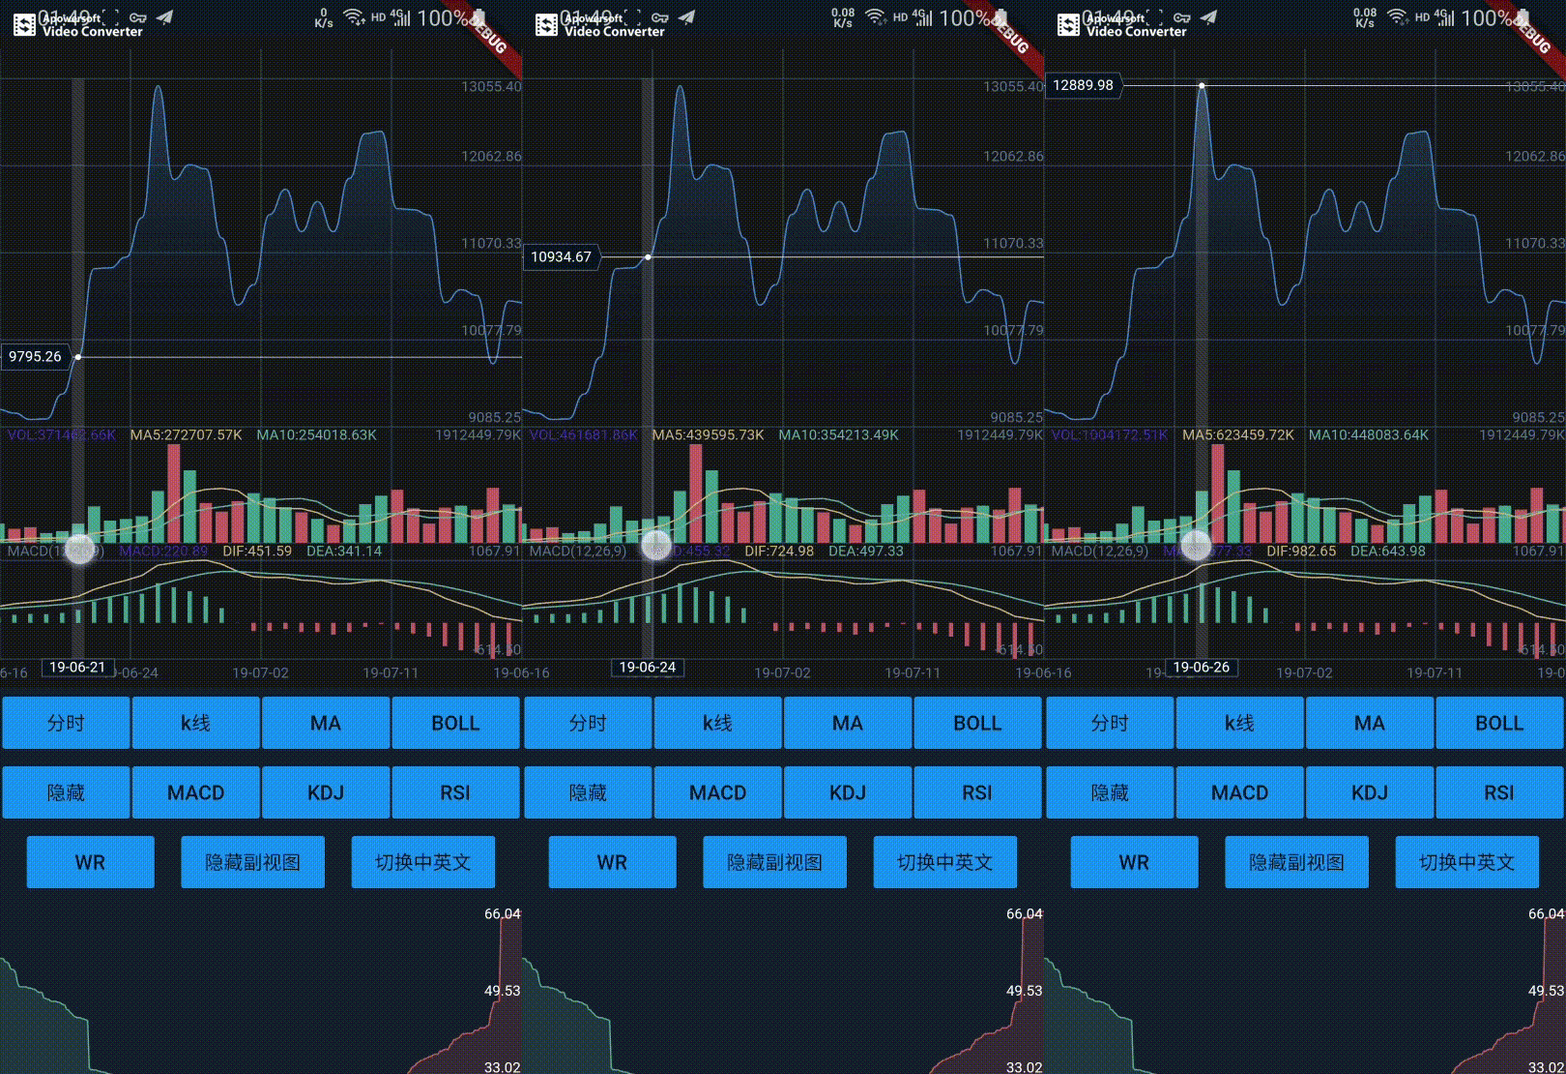
Overview
k_chart is a Flutter package for rendering K-line charts, commonly used in financial and cryptocurrency data visualization. It provides a customizable and performant solution for displaying price trends over time with support for multiple chart types, touch interactions, and real-time updates. Built with Dart, it integrates seamlessly into Flutter apps across Android, iOS, Web, macOS, Windows, and Linux platforms. The package is ideal for trading apps, analytics dashboards, and any application requiring detailed time-series data representation.
Use cases
- Financial market analysis
- Cryptocurrency price tracking
- Trading platform UIs
- Real-time data visualization
- Stock trend monitoring
Key features
- K-line (candlestick) chart support
- Customizable chart themes
- Touch gestures for zoom and pan
- Real-time data streaming
- Multiple time interval options
Suitable for
- Developers building finance apps
- UI designers needing interactive charts
- Applications requiring time-series data display
- Cross-platform chart integration
Considerations
- Requires understanding of financial charting concepts
- Performance may vary with large datasets
- Limited built-in indicators beyond basic ones
- Custom styling requires familiarity with Flutter widgets