

 v5.4.0
pie_chart
सुंदर पाई चार्ट बनाने और अद्भुत एनीमेशन के लिए एक Flutter पैकेज।
440लाइक 31.1 हज़ार30-दिन डाउनलोड140Pub अंक
AndroidiOSWebmacOSWindowsLinux
एनिमेशन के साथ फ्लटर पाई चार्ट

यह अंग्रेज़ी मूल स्नैपशॉट है। नवीनतम सामग्री GitHub पर देखें।


This Flutter package provides a Pie Chart Widget with cool animation.
More discussions on Discord: https://discord.gg/7byeCn7MGF
Live Demo: https://apgapg.github.io/pie_chart/

In the dependencies: section of your pubspec.yaml, add the following line:

dependencies:
  pie_chart: <latest version>
import 'package:pie_chart/pie_chart.dart';
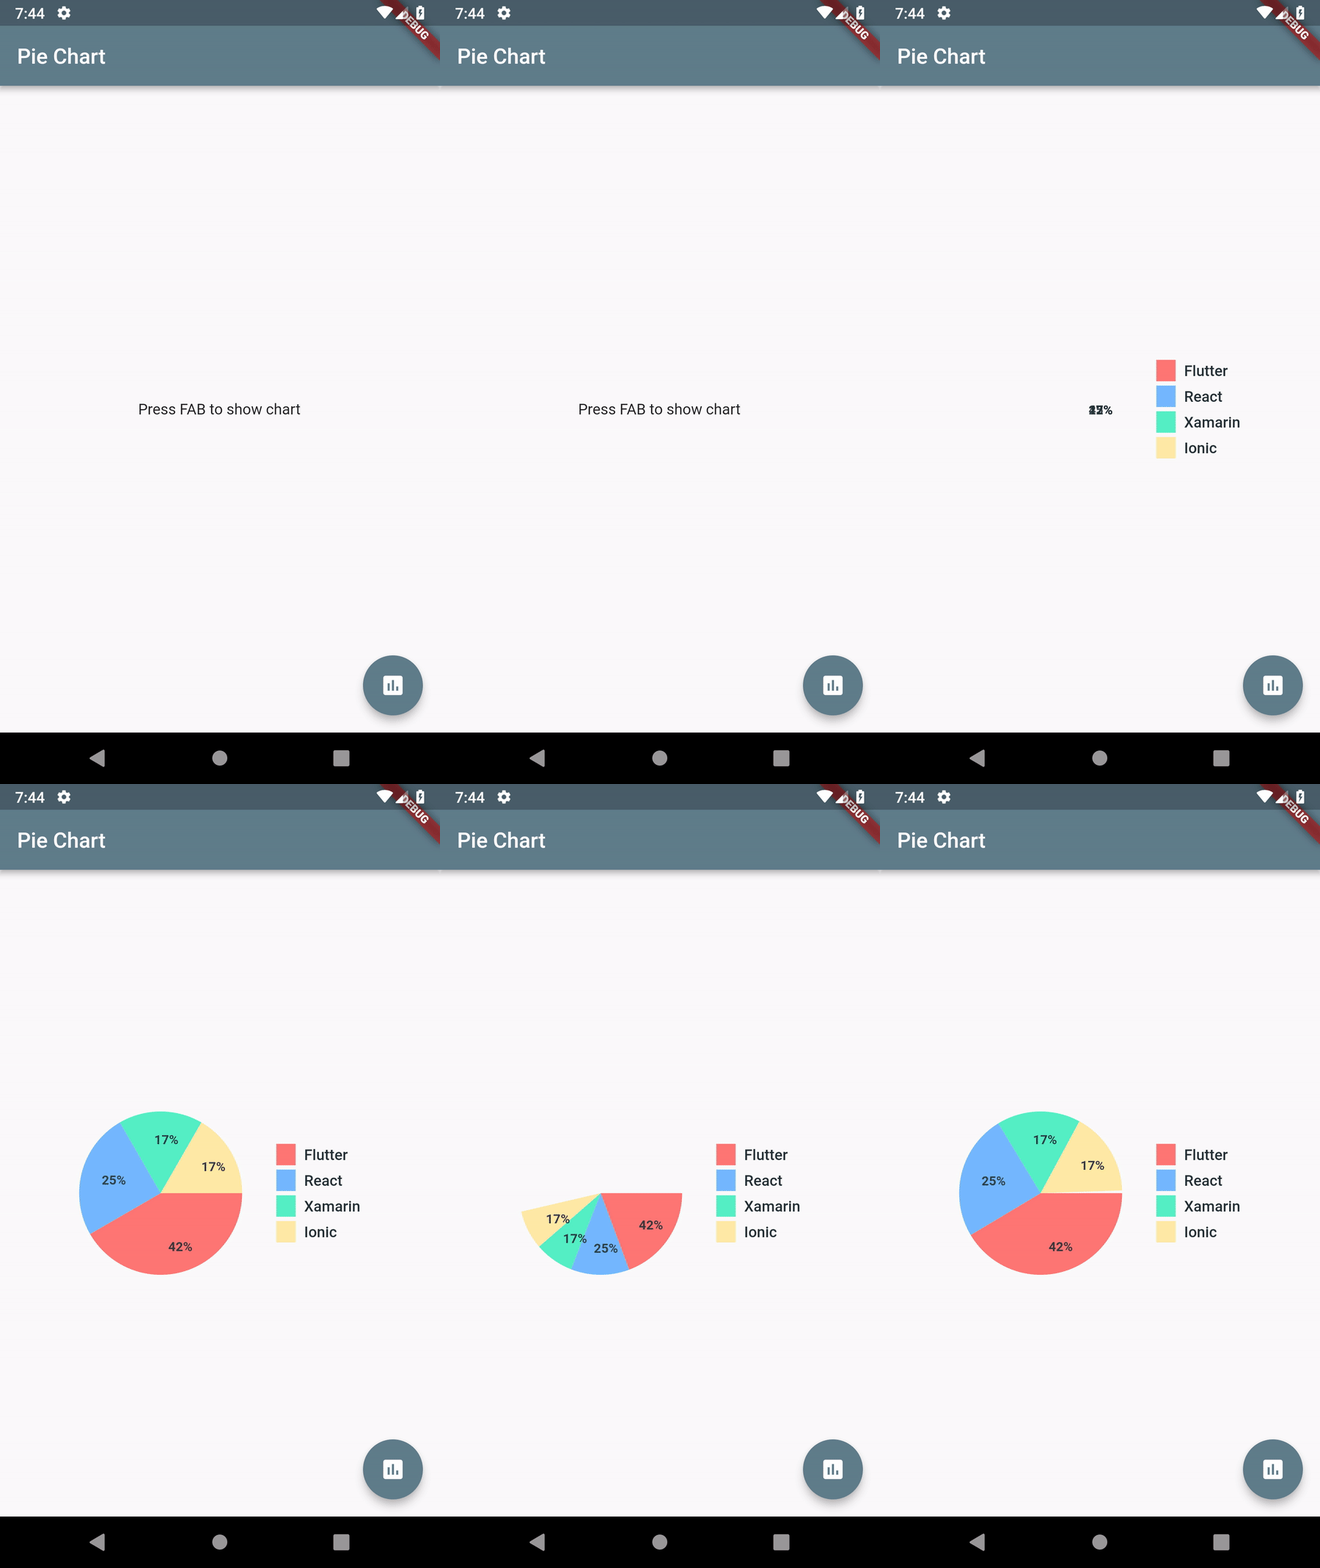
Map<String, double> dataMap = {
    "Flutter": 5,
    "React": 3,
    "Xamarin": 2,
    "Ionic": 2,
  };
PieChart(dataMap: dataMap)
PieChart(
      dataMap: dataMap,
      animationDuration: Duration(milliseconds: 800),
      chartLegendSpacing: 32,
      chartRadius: MediaQuery.of(context).size.width / 3.2,
      colorList: colorList,
      initialAngleInDegree: 0,
      chartType: ChartType.ring,
      ringStrokeWidth: 32,
      centerText: "HYBRID",
      legendOptions: LegendOptions(
        showLegendsInRow: false,
        legendPosition: LegendPosition.right,
        showLegends: true,
        legendShape: _BoxShape.circle,
        legendTextStyle: TextStyle(
          fontWeight: FontWeight.bold,
        ),
      ),
      chartValuesOptions: ChartValuesOptions(
        showChartValueBackground: true,
        showChartValues: true,
        showChartValuesInPercentage: false,
        showChartValuesOutside: false,
        decimalPlaces: 1,
      ),
      // gradientList: ---To add gradient colors---
      // emptyColorGradient: ---Empty Color gradient---
    )
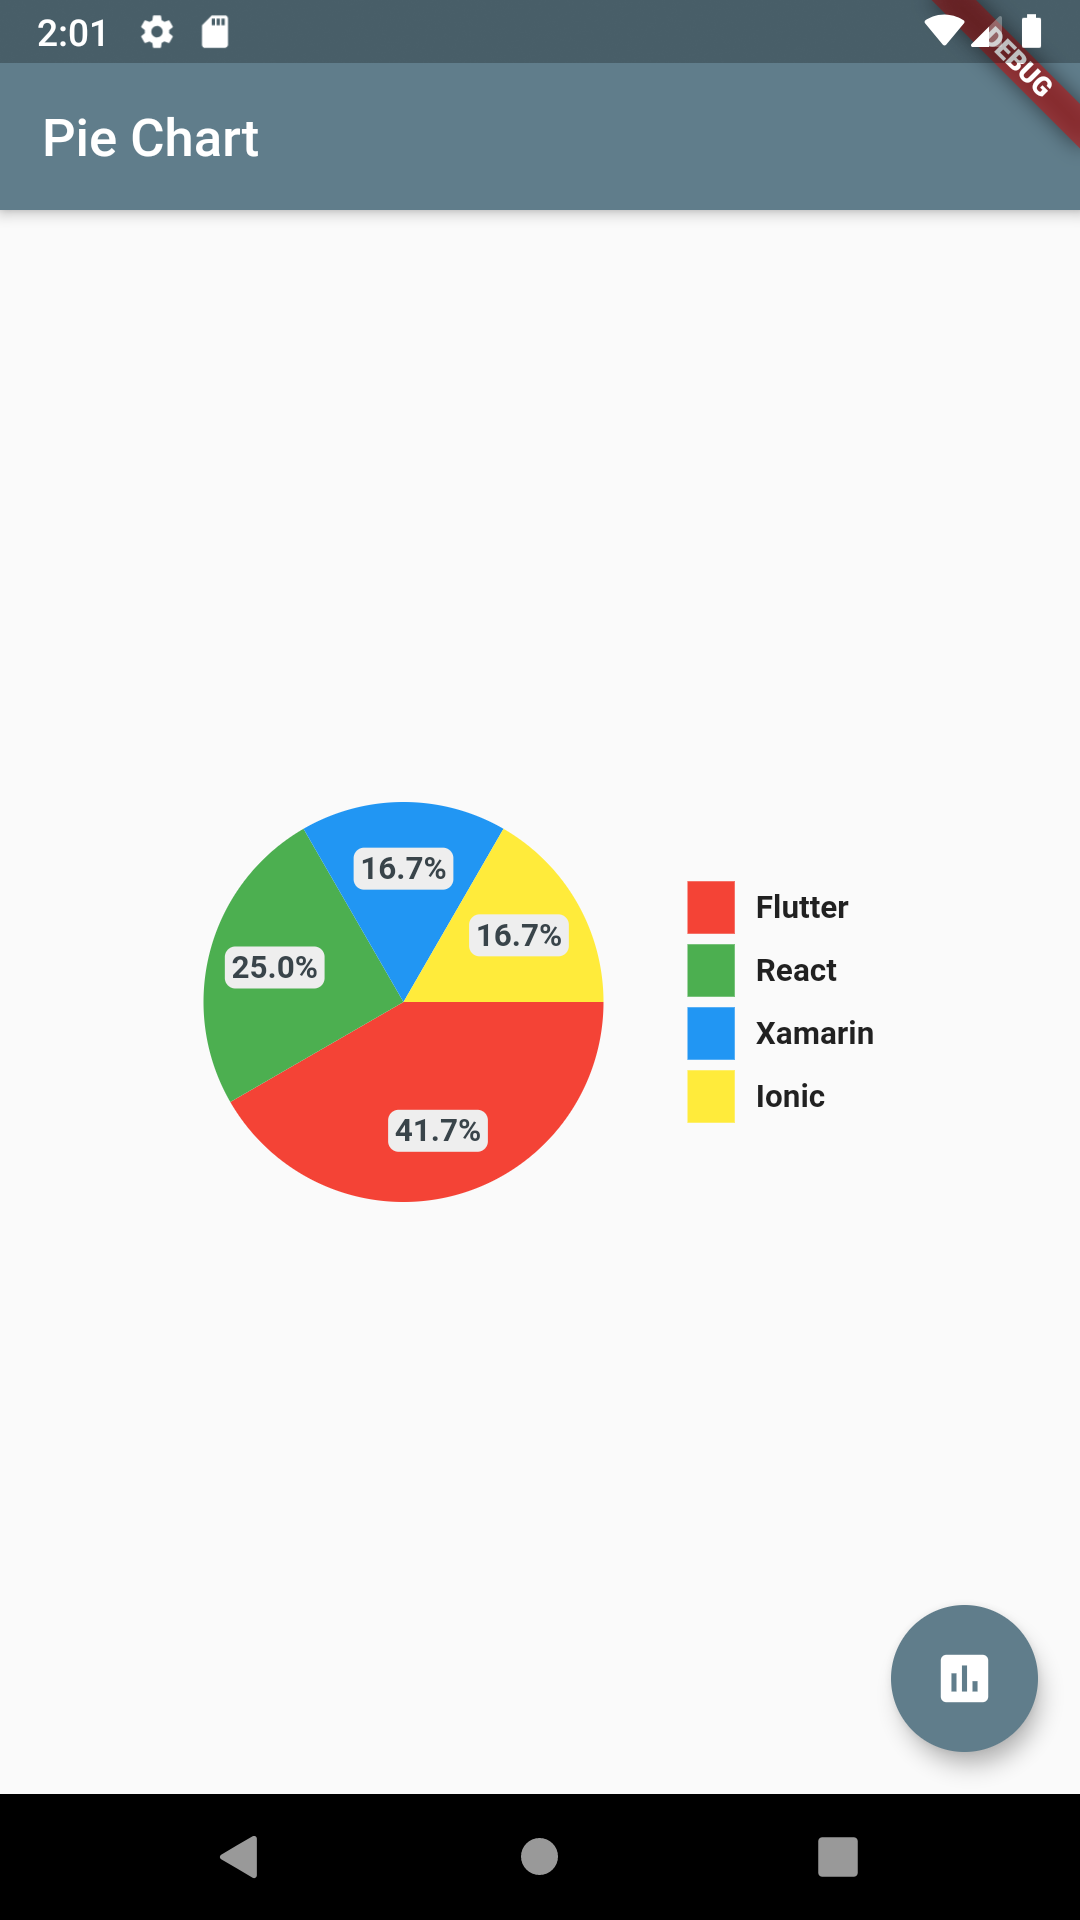
chartValuesOptions: ChartValuesOptions(
  decimalPlaces: 1,
),
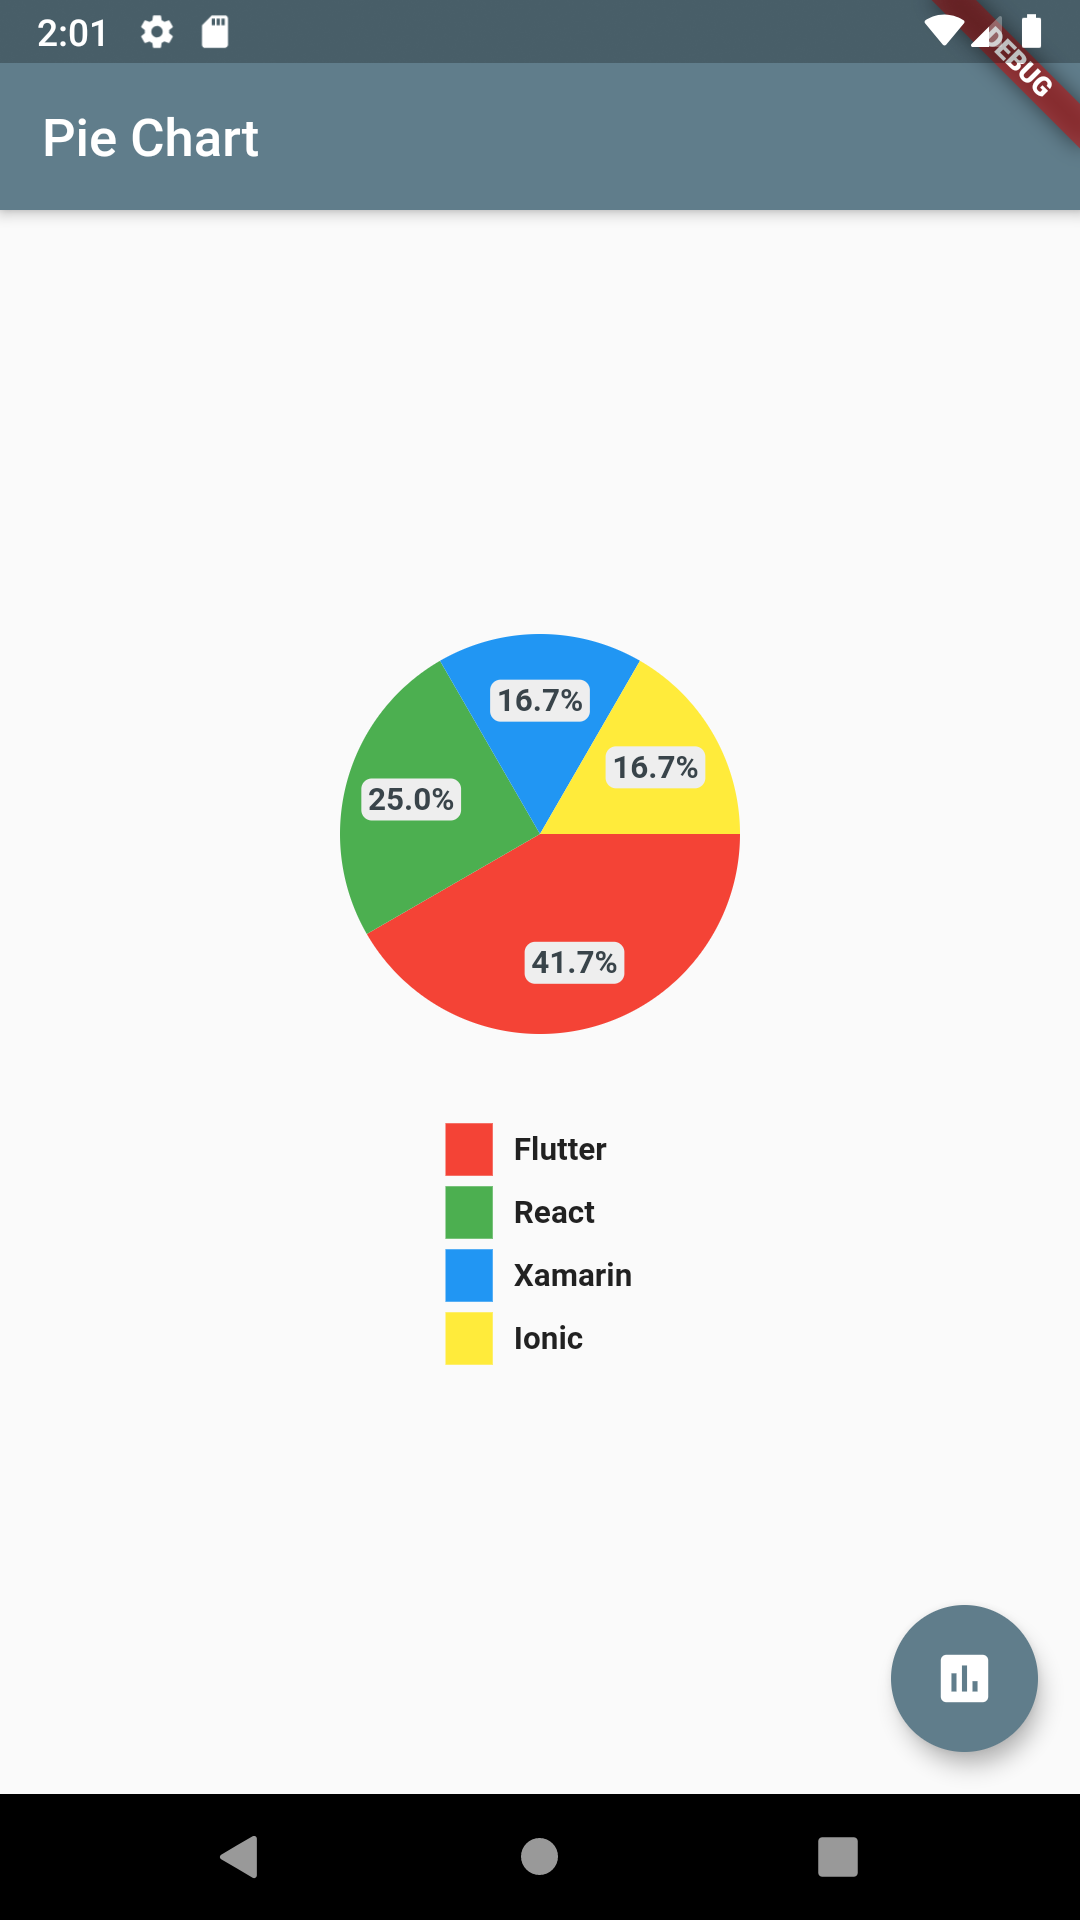
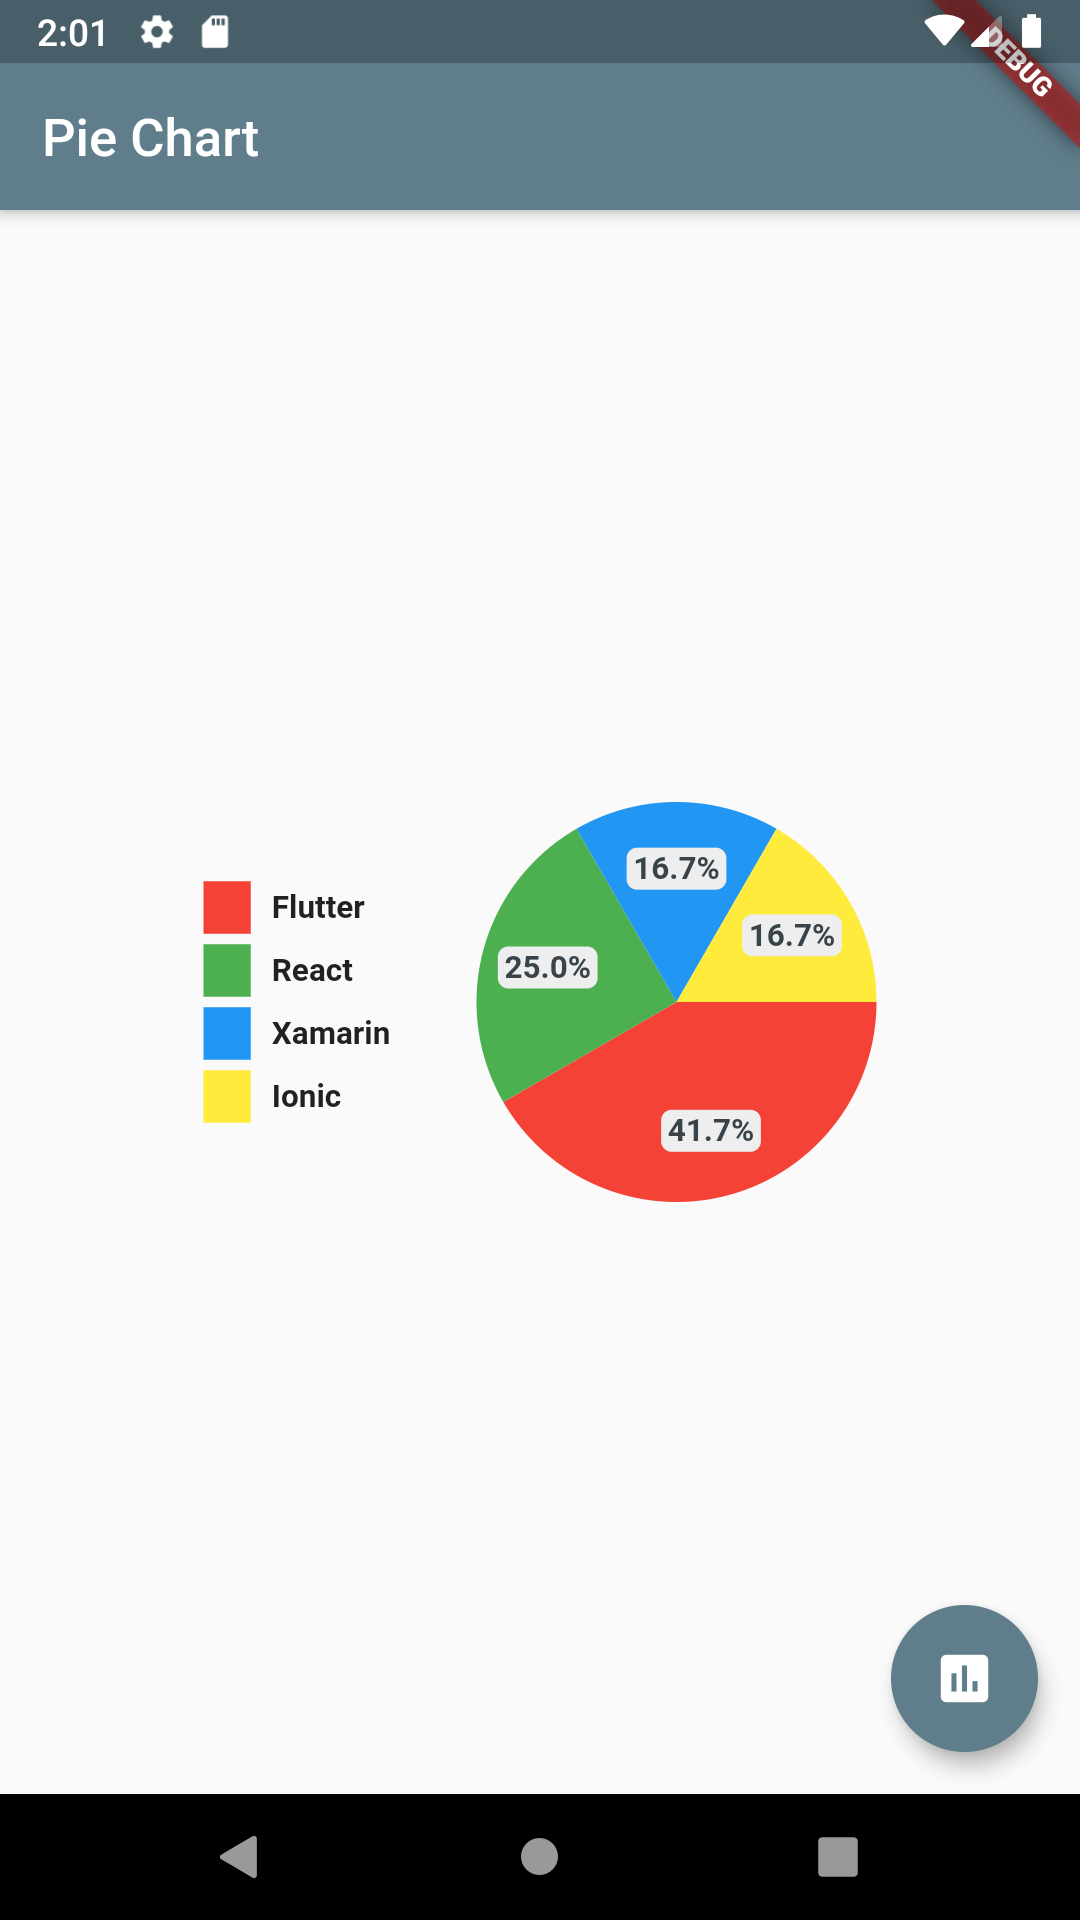
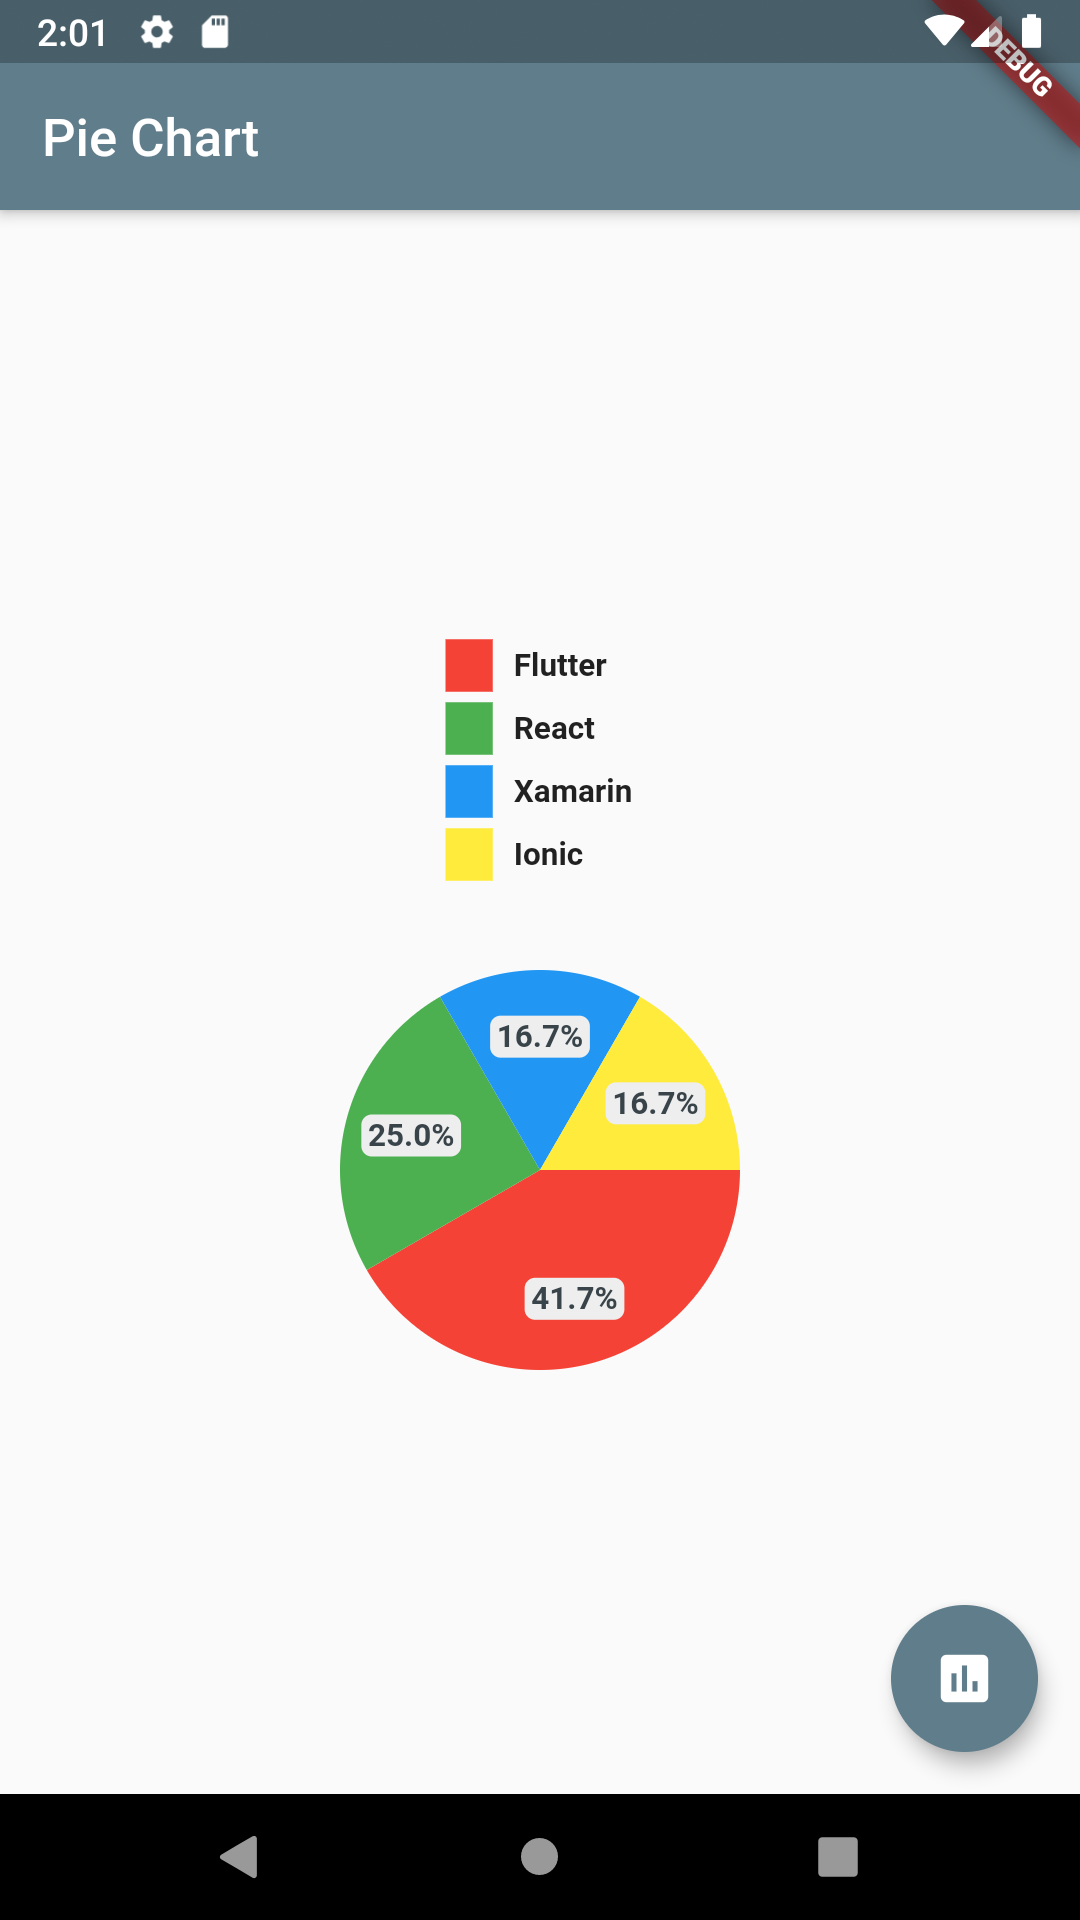
chartType: ChartType.ring,
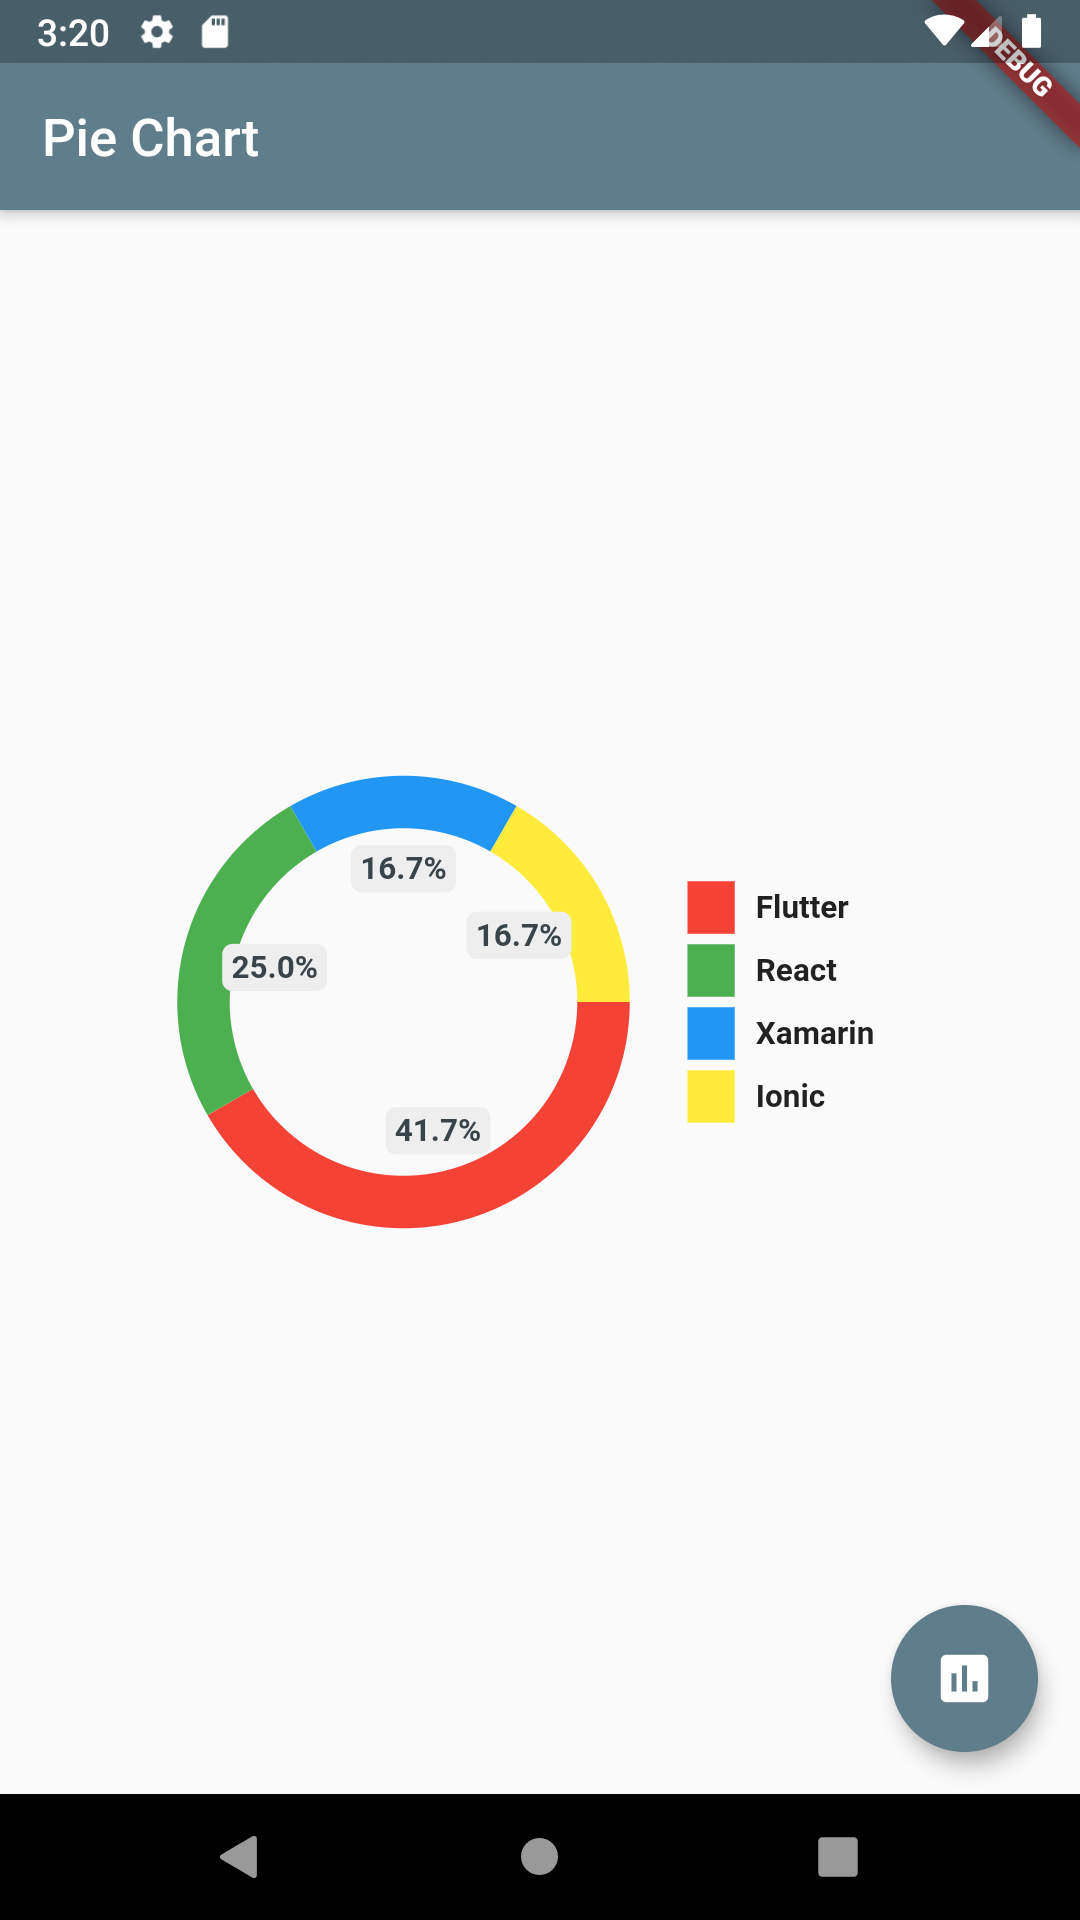
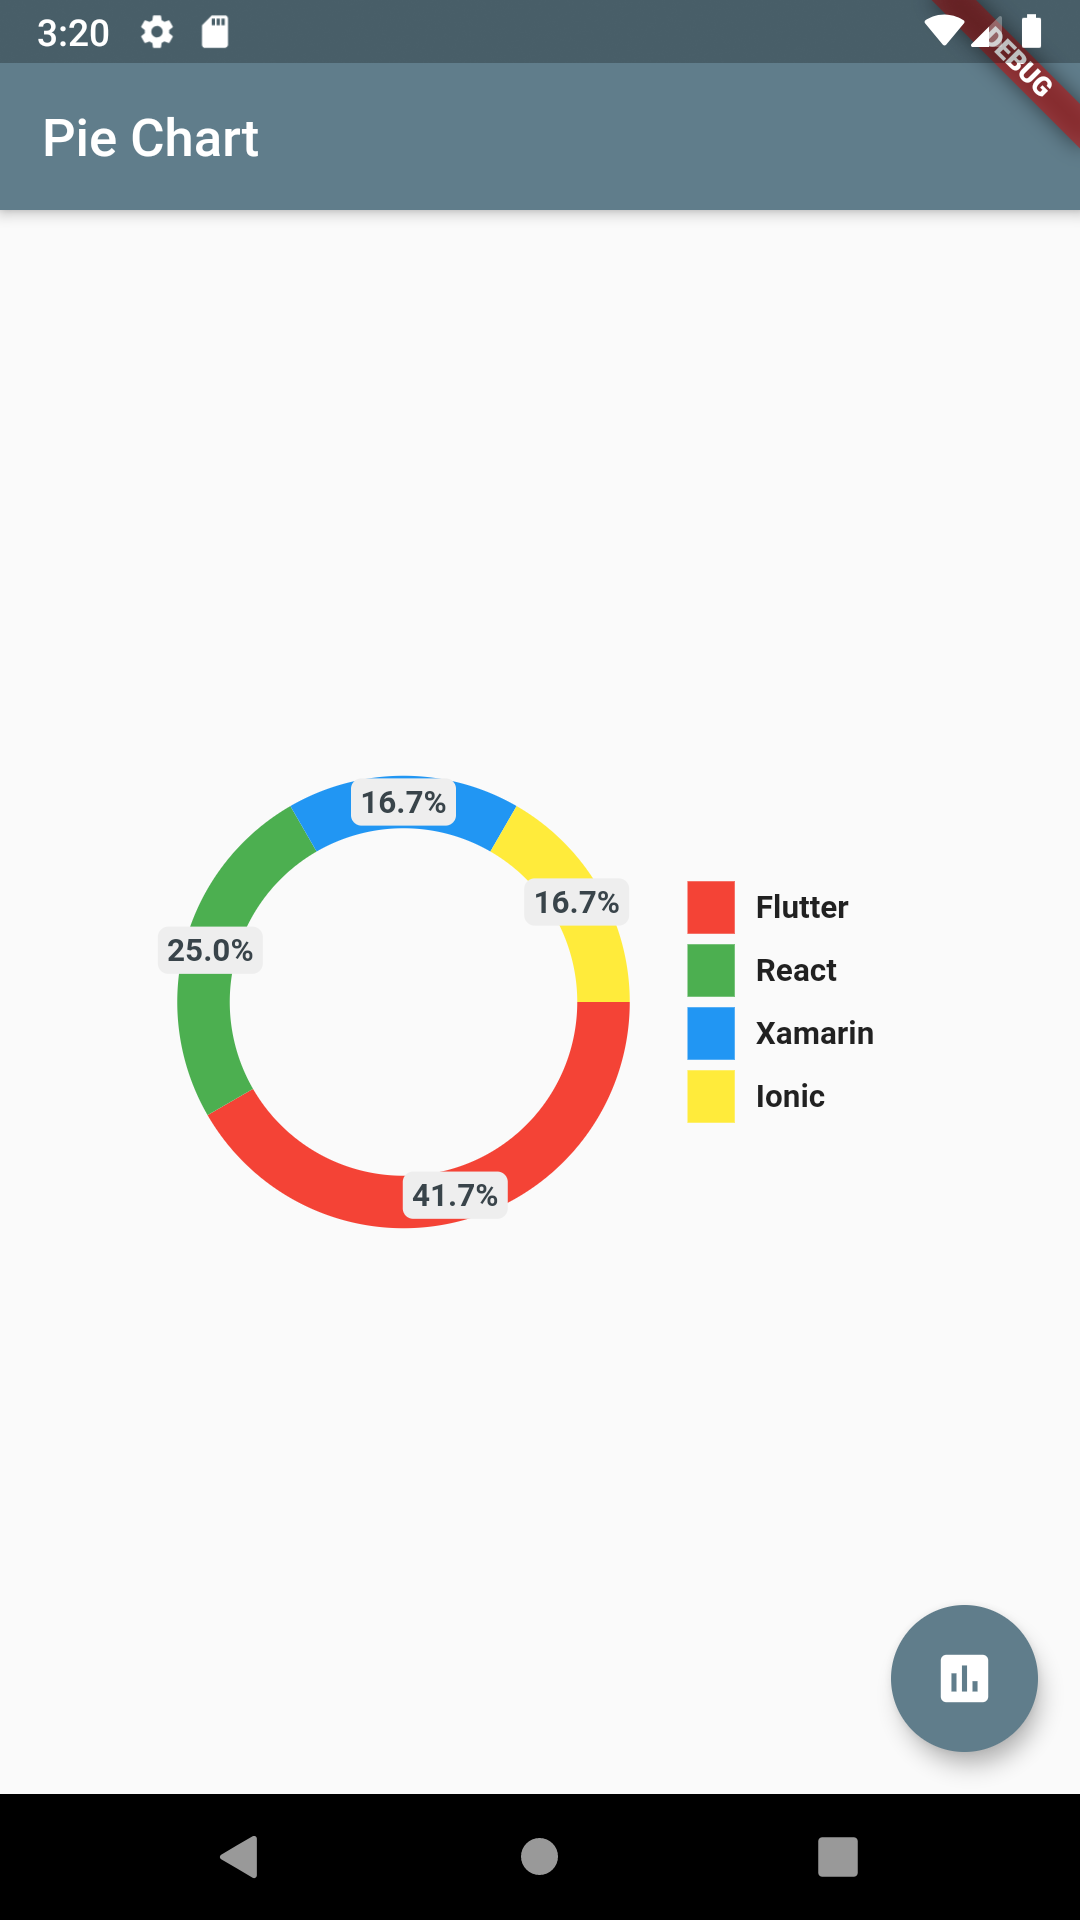
chartType: ChartType.ring,
showChartValuesOutside: true,
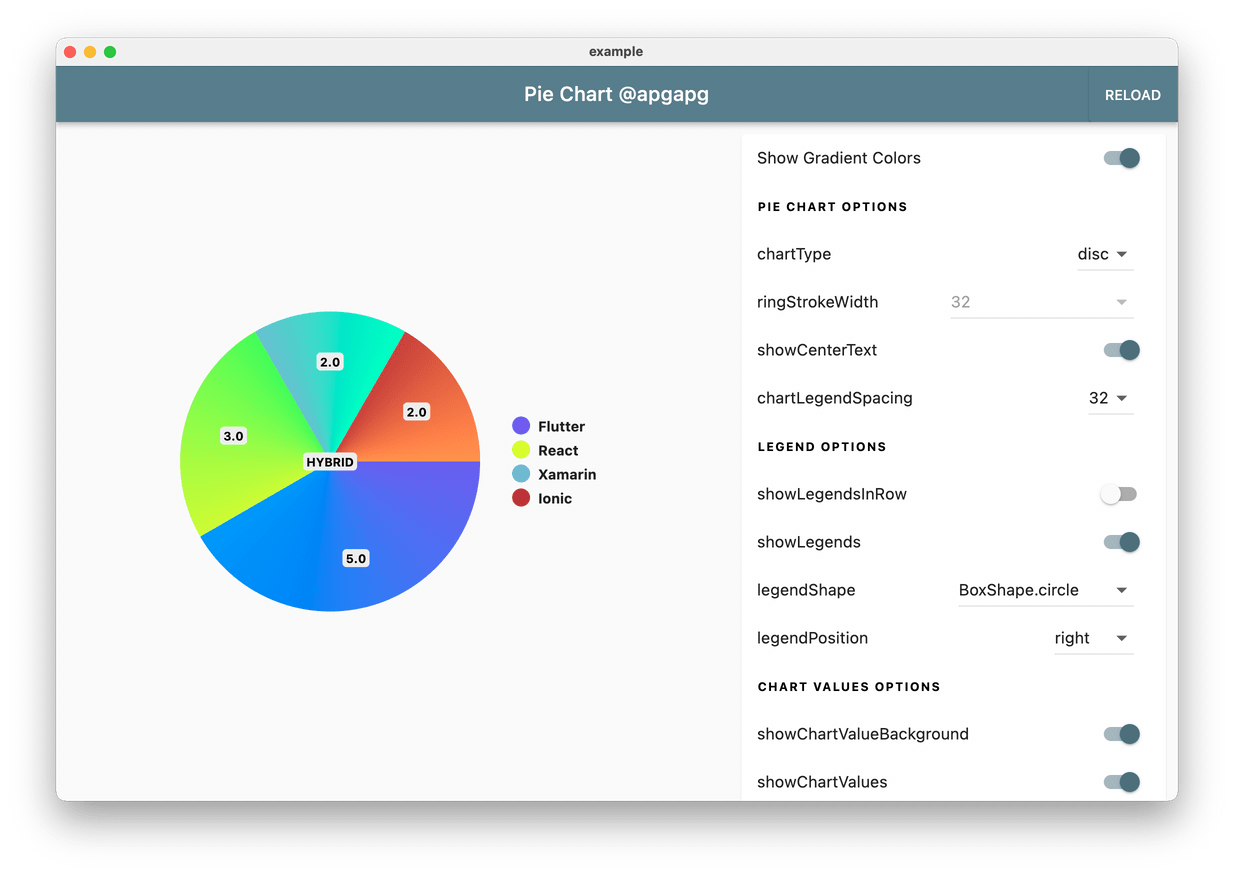
Pie Chart supports gradient as colors. Just pass gradientList instead of colorList to add gradient to chart colors.
final gradientList = <List<Color>>[
  [
    Color.fromRGBO(223, 250, 92, 1),
    Color.fromRGBO(129, 250, 112, 1),
  ],
  [
    Color.fromRGBO(129, 182, 205, 1),
    Color.fromRGBO(91, 253, 199, 1),
  ],
  [
    Color.fromRGBO(175, 63, 62, 1.0),
    Color.fromRGBO(254, 154, 92, 1),
  ]
];

// Pass gradient to PieChart
gradientList: gradientList,
emptyColorGradient: [
 Color(0xff6c5ce7),
 Colors.blue,
],
Add a base pie-chart color via:
baseChartColor: Colors.grey
Full code:
class HomePage2 extends StatelessWidget {
  HomePage2({Key? key}) : super(key: key);

  final dataMap = <String, double>{
    "Flutter": 5,
  };

  final colorList = <Color>[
    Colors.greenAccent,
  ];

  @override
  Widget build(BuildContext context) {
    return Scaffold(
      appBar: AppBar(
        title: Text("Pie Chart 1"),
      ),
      body: Container(
        padding: EdgeInsets.symmetric(horizontal: 16),
        child: PieChart(
          dataMap: dataMap,
          chartType: ChartType.ring,
          baseChartColor: Colors.grey[300]!,
          colorList: colorList,
        ),
      ),
    );
  }
}
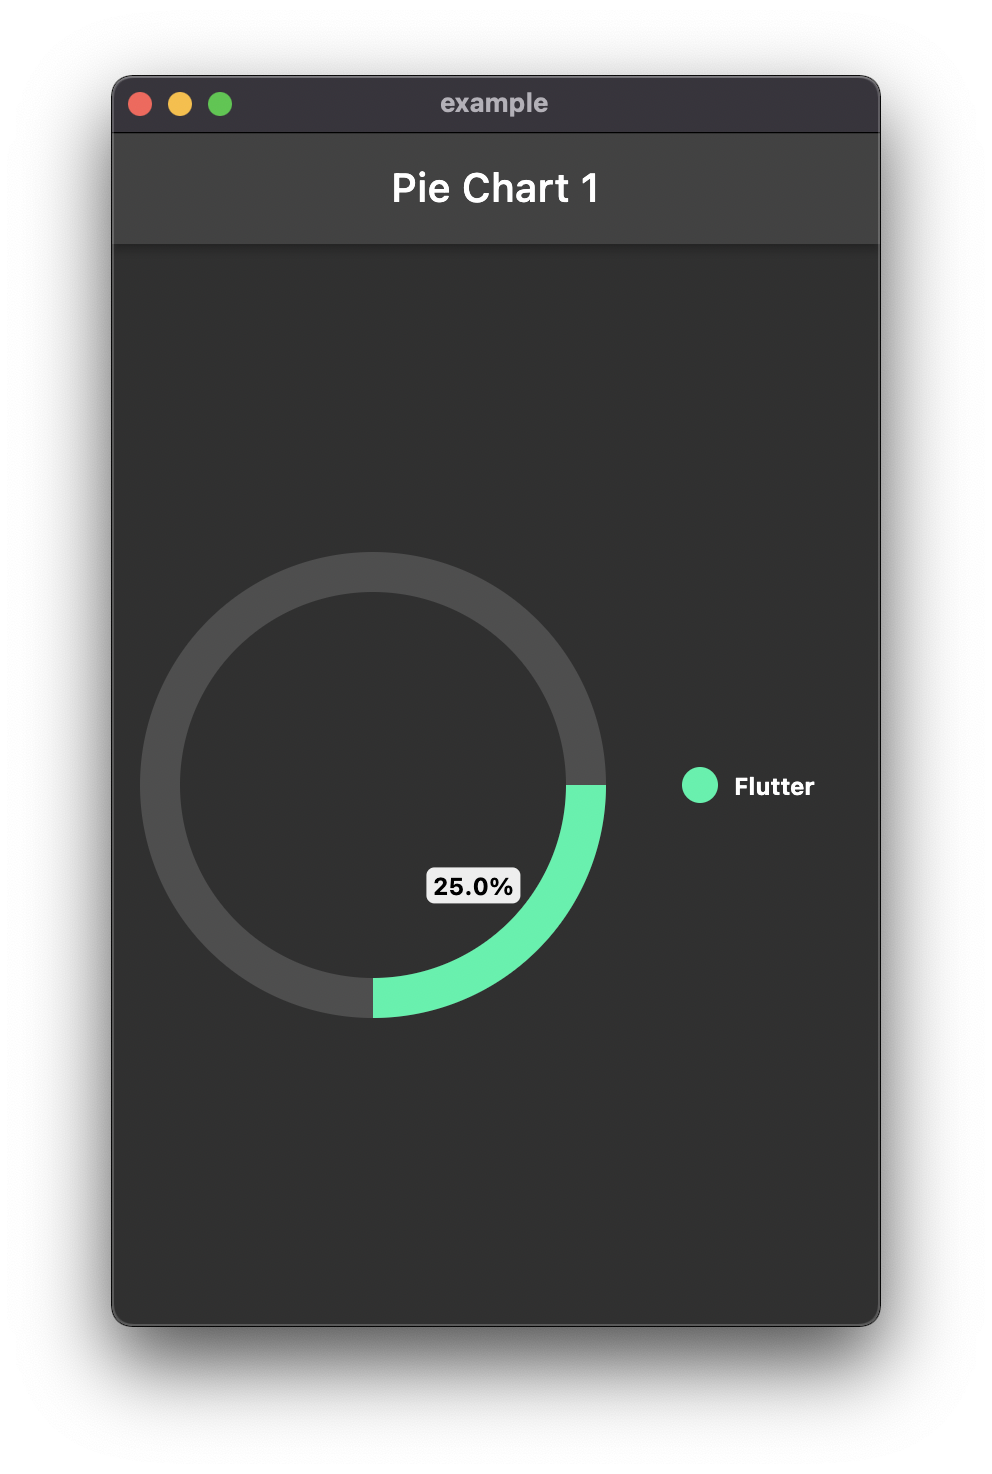
To show chart arcs based on your total value, add totalValue option.
class HomePage2 extends StatelessWidget {
  HomePage2({Key? key}) : super(key: key);

  final dataMap = <String, double>{
    "Flutter": 5,
  };

  final colorList = <Color>[
    Colors.greenAccent,
  ];

  @override
  Widget build(BuildContext context) {
    return Scaffold(
      appBar: AppBar(
        title: Text("Pie Chart 1"),
      ),
      body: Container(
        padding: EdgeInsets.symmetric(horizontal: 16),
        child: PieChart(
          dataMap: dataMap,
          chartType: ChartType.ring,
          baseChartColor: Colors.grey[50]!.withOpacity(0.15),
          colorList: colorList,
          chartValuesOptions: ChartValuesOptions(
            showChartValuesInPercentage: true,
          ),
          totalValue: 20,
        ),
      ),
    );
  }
}
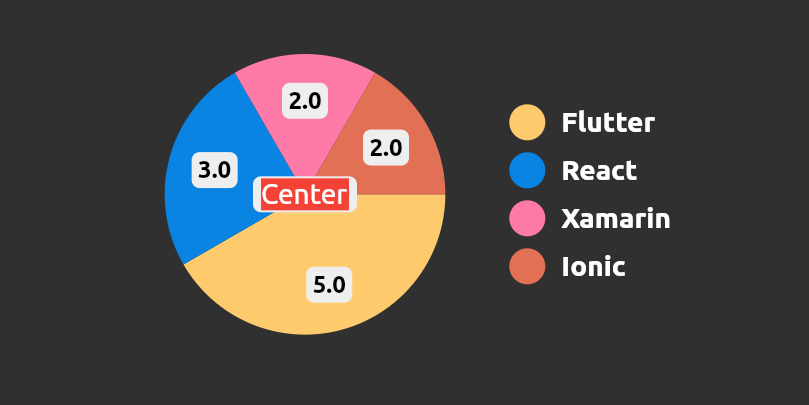
Creates a new widget placed at pie chart center
centerWidget: Container(color: Colors.red, child: const Text("Center"))
 Create Flutter Json Table from json map directly.
 Flutter Avatar Glow Widget with glowing animation.
 Flutter Search Widget for selecting an option from list.
 Flutter Animating Location Pin Widget providing Animating Location Pin Widget which can be used while fetching device location.
 Showcase My Portfolio: Ayush P Gupta on Playstore.
 Flutter App which allows reading/uploading short stories.
निर्भरता सूची 3 आइटम
{"sdk":"flutter"}{"sdk":"flutter"}^2.0.1उपयोग के अनुसार छाँटें, गतिविधि की तुलना करें और अपनाने से पहले मूल प्रोजेक्ट की आवश्यकताएँ जाँचें।
“A repository is the most basic element of GitHub.”
GitHub Docs — About repositories ↗