
 v0.7.0
vector_map
Flutter用のベクターマップ。非常にカスタマイズ可能。GeoJSONと互換性あり。マップチャート。純粋なFlutter。
80いいね 9030日間ダウンロード150Pub ポイント
AndroidiOSWebmacOSWindowsLinux
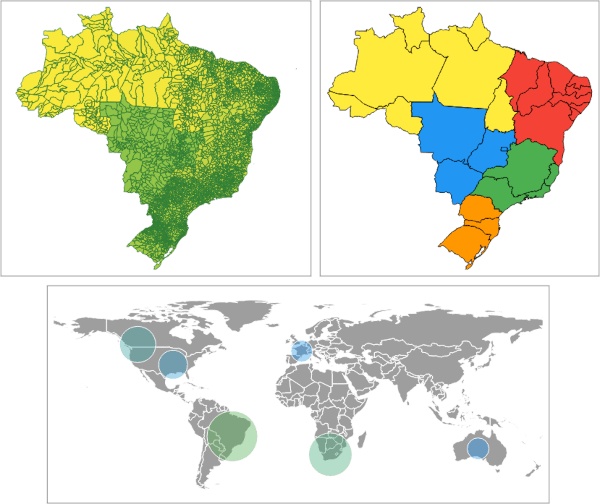
Flutter用ベクターマップ

{"sdk":"flutter"}^1.7.0{"sdk":"flutter"}以下は英語原文のスナップショットです。最新版は GitHub をご覧ください。
pub pub2 pub3 https://img.shields.io/badge/donate-crypto-green
https://raw.githubusercontent.com/caduandrade/images/main/vector_map/vector_map_v1.png
Simplified GeoJSONs will be used in the examples to demonstrate package usage. The following examples will assume that GeoJSONs have already been loaded into Strings. The full code is at https://github.com/caduandrade/vector_map_flutter_demo.
polygons.json (link)
| Name | Seq | Rnd | Gts |
|---|---|---|---|
| "Einstein" | 1 | "73" | 15000 |
| "Newton" | 2 | "92" | 7500 |
| "Galileu" | 3 | "10" | 3000 |
| "Darwin" | 4 | 15000 | |
| "Pasteur" | 5 | "77" | 17000 |
| "Faraday" | 6 | "32" | 17500 |
| "Arquimedes" | 7 | "87" | 25000 |
| "Tesla" | 8 | "17" | 12500 |
| "Lavoisier" | 9 | 4000 | |
| "Kepler" | 10 | "32" | 18000 |
| "Turing" | 11 | "93" | 31400 |
points.json (link)
| Name | AN |
|---|---|
| "Titanium" | 22 |
| "Niobium" | 41 |
| "Carbon" | 6 |
| "Neon" | 10 |
| "Silicon" | 14 |
| "Hydrogen" | 1 |
Reading the geometries only.
MapDataSource polygons = await MapDataSource.geoJson(geoJson: geoJson);
The keys argument defines which properties must be loaded.
The parseToNumber argument defines which properties will have numeric values in quotes parsed to numbers.
The labelKey defines which property will be used to display its values as feature labels.
  MapDataSource polygons = await MapDataSource.geoJson(
      geoJson: geoJson,
      keys: ['Seq', 'Rnd'],
      parseToNumber: ['Rnd'],
      labelKey: 'Rnd');
VectorMapController _controller = VectorMapController();
  MapDataSource polygons = await MapDataSource.geoJson(geoJson: geoJson);
  MapLayer layer = MapLayer(dataSource: polygons);
  _controller.addLayer(layer);
VectorMap map = VectorMap(controller: _controller);
https://raw.githubusercontent.com/caduandrade/images/main/vector_map/get_started_v1.png
  MapLayer layer = MapLayer(
      dataSource: polygons,
      theme: MapTheme(color: Colors.yellow, contourColor: Colors.red));
https://raw.githubusercontent.com/caduandrade/images/main/vector_map/default_colors_v1.png
  MapDataSource polygons =
      await MapDataSource.geoJson(geoJson: geoJson, labelKey: 'Name');
  MapLayer layer = MapLayer(
      dataSource: polygons,
      theme: MapTheme(labelVisibility: (feature) => true));
https://raw.githubusercontent.com/caduandrade/images/main/vector_map/label_visible_v1.png
  MapLayer layer = MapLayer(
      dataSource: polygons,
      theme: MapTheme(labelVisibility: (feature) => feature.label == 'Darwin'));
https://raw.githubusercontent.com/caduandrade/images/main/vector_map/label_rule_v1.png
  MapLayer layer = MapLayer(
      dataSource: polygons,
      theme: MapTheme(
          labelVisibility: (feature) => true,
          labelStyleBuilder: (feature, featureColor, labelColor) {
            if (feature.label == 'Darwin') {
              return TextStyle(
                color: labelColor,
                fontWeight: FontWeight.bold,
                fontSize: 11,
              );
            }
            return TextStyle(
              color: labelColor,
              fontSize: 11,
            );
          }));
https://raw.githubusercontent.com/caduandrade/images/main/vector_map/label_style_v1.png
Sets a color for each property value in GeoJSON. If a color is not set, the default color is used.
Mapping the property key:
  MapDataSource polygons = await MapDataSource.geoJson(
      geoJson: geoJson, keys: ['Seq'], labelKey: 'Seq');
Setting the colors for the property values:
  MapLayer layer = MapLayer(
      dataSource: polygons,
      theme: MapValueTheme(
          contourColor: Colors.white,
          labelVisibility: (feature) => true,
          key: 'Seq',
          colors: {
            2: Colors.green,
            4: Colors.red,
            6: Colors.orange,
            8: Colors.blue
          }));
https://raw.githubusercontent.com/caduandrade/images/main/vector_map/color_by_value_v2.png
The feature color is obtained from the first rule that returns a non-null color. If all rules return a null color, the default color is used.
Mapping the property key:
  MapDataSource polygons =
      await MapDataSource.geoJson(geoJson: geoJson, keys: ['Name', 'Seq']);
Setting the rules:
  MapLayer layer = MapLayer(
      dataSource: polygons,
      theme: MapRuleTheme(contourColor: Colors.white, colorRules: [
        (feature) {
          String? value = feature.getValue('Name');
          return value == 'Faraday' ? Colors.red : null;
        },
        (feature) {
          double? value = feature.getDoubleValue('Seq');
          return value != null && value < 3 ? Colors.green : null;
        },
        (feature) {
          double? value = feature.getDoubleValue('Seq');
          return value != null && value > 9 ? Colors.blue : null;
        }
      ]));
https://raw.githubusercontent.com/caduandrade/images/main/vector_map/color_by_rule_v1.png
The gradient is created given the colors and limit values of the chosen property. The property must have numeric values.
Uses the min and max values read from data source.
  MapDataSource polygons = await MapDataSource.geoJson(
      geoJson: geoJson, keys: ['Seq'], labelKey: 'Seq');
  MapLayer layer = MapLayer(
      dataSource: polygons,
      theme: MapGradientTheme(
          contourColor: Colors.white,
          labelVisibility: (feature) => true,
          key: 'Seq',
          colors: [Colors.blue, Colors.yellow, Colors.red]));
https://raw.githubusercontent.com/caduandrade/images/main/vector_map/gradient_auto_v2.png
If the min value is set, all lower values will be displayed using the first gradient color.
If the max value is set, all higher values will be displayed using the last gradient color.
  MapDataSource polygons = await MapDataSource.geoJson(
      geoJson: geoJson, keys: ['Seq'], labelKey: 'Seq');
  MapLayer layer = MapLayer(
      dataSource: polygons,
      theme: MapGradientTheme(
          contourColor: Colors.white,
          labelVisibility: (feature) => true,
          key: 'Seq',
          min: 3,
          max: 9,
          colors: [Colors.blue, Colors.yellow, Colors.red]));
https://raw.githubusercontent.com/caduandrade/images/main/vector_map/gradient_min_max_v2.png
Used by addons and cursor hover to highlight layer features on the map.
  MapLayer layer = MapLayer(
      dataSource: polygons,
      highlightTheme: MapHighlightTheme(color: Colors.green));
https://raw.githubusercontent.com/caduandrade/images/main/vector_map/hover_color_v1.png
  MapLayer layer = MapLayer(
      dataSource: polygons,
      highlightTheme: MapHighlightTheme(contourColor: Colors.red));
https://raw.githubusercontent.com/caduandrade/images/main/vector_map/hover_contour_v1.png
  MapDataSource polygons =
      await MapDataSource.geoJson(geoJson: geoJson, labelKey: 'Name');
  MapLayer layer = MapLayer(
      dataSource: polygons,
      highlightTheme: MapHighlightTheme(labelVisibility: (feature) => true));
https://raw.githubusercontent.com/caduandrade/images/main/vector_map/label_hover_v1.png
VectorMapController _controller = VectorMapController(contourThickness: 3);
https://raw.githubusercontent.com/caduandrade/images/main/vector_map/contour_thickness_v1.png
  MapDataSource polygons =
      await MapDataSource.geoJson(geoJson: geoJson, keys: ['Seq']);
  // coloring only the 'Darwin' feature
  MapLayer layer = MapLayer(
      dataSource: polygons,
      theme: MapValueTheme(key: 'Seq', colors: {4: Colors.green}),
      highlightTheme: MapHighlightTheme(color: Colors.green[900]!));
  // enabling hover only for the 'Darwin' feature
  VectorMap map = VectorMap(
      controller: _controller,
      hoverRule: (feature) {
        return feature.getValue('Seq') == 4;
      });
https://raw.githubusercontent.com/caduandrade/images/main/vector_map/enable_hover_by_value_v1.gif
  VectorMap map = VectorMap(
      controller: _controller,
      hoverListener: (MapFeature? feature) {
        if (feature != null) {
          int id = feature.id;
        }
      });
  MapHighlightTheme highlightTheme = MapHighlightTheme(color: Colors.green);

  MapDataSource polygons =
      await MapDataSource.geoJson(geoJson: polygonsGeoJson);
  MapLayer polygonLayer =
      MapLayer(dataSource: polygons, highlightTheme: highlightTheme);
  _controller.addLayer(polygonLayer);

  MapDataSource points = await MapDataSource.geoJson(geoJson: pointsGeoJson);
  MapLayer pointsLayer = MapLayer(
      dataSource: points,
      theme: MapTheme(color: Colors.black),
      highlightTheme: highlightTheme);
  _controller.addLayer(pointsLayer);
https://raw.githubusercontent.com/caduandrade/images/main/vector_map/multiple_layers_v1.gif
Allows you to draw the contour over all layers
  MapDataSource dataSource1 = MapDataSource.geometries([
    MapPolygon.coordinates([2, 3, 4, 5, 6, 3, 4, 1, 2, 3])
  ]);
  MapDataSource dataSource2 = MapDataSource.geometries([
    MapPolygon.coordinates([0, 2, 2, 4, 4, 2, 2, 0, 0, 2]),
    MapPolygon.coordinates([4, 2, 6, 4, 8, 2, 6, 0, 4, 2])
  ]);
Overlay disabled:
  MapHighlightTheme highlightTheme =
      MapHighlightTheme(color: Colors.black, contourColor: Colors.black);

  MapLayer layer1 = MapLayer(
      dataSource: dataSource1,
      theme: MapTheme(color: Colors.yellow, contourColor: Colors.black),
      highlightTheme: highlightTheme);
  MapLayer layer2 = MapLayer(
      dataSource: dataSource2,
      theme: MapTheme(color: Colors.green, contourColor: Colors.black),
      highlightTheme: highlightTheme);

  _controller = VectorMapController(layers: [layer1, layer2]);
https://raw.githubusercontent.com/caduandrade/images/main/vector_map/overlay_contour_off_v1.gif
Overlay enabled:
  MapLayer layer1 = MapLayer(
      dataSource: dataSource1,
      theme: MapTheme(color: Colors.yellow, contourColor: Colors.black),
      highlightTheme: MapHighlightTheme(
          color: Colors.black,
          contourColor: Colors.black,
          overlayContour: true));
  MapLayer layer2 = MapLayer(
      dataSource: dataSource2,
      theme: MapTheme(color: Colors.green, contourColor: Colors.black),
      highlightTheme:
          MapHighlightTheme(color: Colors.black, contourColor: Colors.black));

  _controller = VectorMapController(layers: [layer1, layer2]);
https://raw.githubusercontent.com/caduandrade/images/main/vector_map/overlay_contour_on_v1.gif
Allows different displays for point geometry.
Default marker.
Sets a fixed size radius.
  MapDataSource polygons =
      await MapDataSource.geoJson(geoJson: polygonsGeoJson);
  MapLayer polygonsLayer = MapLayer(dataSource: polygons);
  _controller.addLayer(polygonsLayer);

  MapDataSource points = await MapDataSource.geoJson(
      geoJson: pointsGeoJson, keys: ['AN'], labelKey: 'AN');
  MapLayer pointsLayer = MapLayer(
      dataSource: points,
      theme: MapTheme(
          color: Colors.black,
          markerBuilder: CircleMakerBuilder.fixed(radius: 15)));
  _controller.addLayer(pointsLayer);
https://raw.githubusercontent.com/caduandrade/images/main/vector_map/circle_marker_fixed_v1.png
Maps property values to radius values.
  MapDataSource polygons =
      await MapDataSource.geoJson(geoJson: polygonsGeoJson);
  MapLayer polygonsLayer = MapLayer(dataSource: polygons);
  _controller.addLayer(polygonsLayer);

  MapDataSource points = await MapDataSource.geoJson(
      geoJson: pointsGeoJson, keys: ['AN'], labelKey: 'AN');
  MapLayer pointsLayer = MapLayer(
      dataSource: points,
      theme: MapTheme(
          color: Colors.black,
          labelVisibility: (feature) => true,
          markerBuilder: CircleMakerBuilder.map(
              key: 'AN', radiuses: {41: 25, 22: 20, 14: 10, 10: 10})));
  _controller.addLayer(pointsLayer);
https://raw.githubusercontent.com/caduandrade/images/main/vector_map/circle_marker_map_v2.png
Uses the property values as radius values.
  MapDataSource polygons =
      await MapDataSource.geoJson(geoJson: polygonsGeoJson);
  MapLayer polygonsLayer = MapLayer(dataSource: polygons);
  _controller.addLayer(polygonsLayer);

  MapDataSource points = await MapDataSource.geoJson(
      geoJson: pointsGeoJson, keys: ['AN'], labelKey: 'AN');
  MapLayer pointsLayer = MapLayer(
      dataSource: points,
      theme: MapTheme(
          color: Colors.black,
          labelVisibility: (feature) => true,
          markerBuilder: CircleMakerBuilder.property(key: 'AN')));
  _controller.addLayer(pointsLayer);
https://raw.githubusercontent.com/caduandrade/images/main/vector_map/circle_marker_property_v2.png
  MapDataSource polygons =
      await MapDataSource.geoJson(geoJson: polygonsGeoJson);
  MapLayer polygonsLayer = MapLayer(dataSource: polygons);
  _controller.addLayer(polygonsLayer);

  MapDataSource points = await MapDataSource.geoJson(
      geoJson: pointsGeoJson, keys: ['AN'], labelKey: 'AN');
  MapLayer pointsLayer = MapLayer(
      dataSource: points,
      theme: MapTheme(
          color: Colors.black,
          labelVisibility: (feature) => true,
          markerBuilder: CircleMakerBuilder.proportion(
              key: 'AN', minRadius: 8, maxRadius: 30)));
  _controller.addLayer(pointsLayer);
https://raw.githubusercontent.com/caduandrade/images/main/vector_map/circle_marker_proportion_v2.png
Allows adding components on the map.
Available customizations:
Legend for gradient themes.
  MapDataSource polygons = await MapDataSource.geoJson(
      geoJson: geoJson, keys: ['Gts'], labelKey: 'Gts');
  MapLayer layer = MapLayer(
      id: 1,
      dataSource: polygons,
      theme: MapGradientTheme(
          contourColor: Colors.white,
          labelVisibility: (feature) => true,
          key: 'Gts',
          colors: [Colors.blue, Colors.yellow, Colors.red]));
  _controller.addLayer(layer);
_addons = [GradientLegend(layer: layer)];
  VectorMap map = VectorMap(
      controller: _controller,
      layersPadding: EdgeInsets.fromLTRB(8, 8, 56, 8),
      addons: _addons);
https://raw.githubusercontent.com/caduandrade/images/main/vector_map/gradient_legend_v2.png
  MapLayer layer = MapLayer(
      id: 1,
      dataSource: polygons,
      theme: MapGradientTheme(
          contourColor: Colors.white,
          labelVisibility: (feature) => true,
          key: 'Gts',
          min: 7500,
          max: 25000,
          colors: [Colors.blue, Colors.yellow, Colors.red]));
https://raw.githubusercontent.com/caduandrade/images/main/vector_map/gradient_legend_min_max_v1.png
  MapLayer layer = MapLayer(
      id: 1,
      dataSource: polygons,
      theme: MapGradientTheme(
          contourColor: Colors.white,
          labelVisibility: (feature) => true,
          key: 'Gts',
          min: 7500,
          max: 25000,
          colors: [Colors.blue, Colors.yellow, Colors.red]),
      highlightTheme: MapHighlightTheme(color: Colors.brown[900]));
https://raw.githubusercontent.com/caduandrade/images/main/vector_map/gradient_legend_highlight_fill_v1.png
Available customizations:
  MapLayer layer = MapLayer(
      id: 1,
      dataSource: polygons,
      theme: MapGradientTheme(
          contourColor: Colors.white,
          labelVisibility: (feature) => true,
          key: 'Gts',
          colors: [Colors.blue, Colors.yellow, Colors.red]));
  _addons = [
    GradientLegend(
        layer: layer,
        barBorder: Border.all(width: 2),
        barHeight: 50,
        barWidth: 30)
  ];
  VectorMap map = VectorMap(
      controller: _controller,
      layersPadding: EdgeInsets.fromLTRB(8, 8, 56, 8),
      addons: _addons);
https://raw.githubusercontent.com/caduandrade/images/main/vector_map/gradient_legend_custom_v1.png
  VectorMap map = VectorMap(
      controller: _controller,
      clickListener: (feature) {
        print('feature id: ${feature.id}');
      });
This is the default mode
  VectorMapController _controller =
      VectorMapController(mode: VectorMapMode.autoFit);
  VectorMapController _controller =
      VectorMapController(mode: VectorMapMode.panAndZoom);
Building a debugger
MapDebugger debugger = MapDebugger();
Binding the debugger on the map
_controller = VectorMapController(debugger: widget.debugger);
Building the debugger widget
MapDebuggerWidget debuggerWidget = MapDebuggerWidget(debugger);
https://caduandrade.github.io/vector_map_flutter/debugger_v1.png
bc1qhqy84y45gya58gtfkvrvass38k4mcyqnav803h
0x9eB815FD4c88A53322304143A9Aa8733D3369985