

v0.1.19
modern_charts
シンプルでありながらモダンな見た目のチャートを作成するためのパッケージ。
45いいね 5330日間ダウンロード30Pub ポイント
プラットフォーム情報なし
jolleekin/modern_charts open-source repository details.

以下は英語原文のスナップショットです。最新版は GitHub をご覧ください。
A package for creating simple yet modern looking charts.
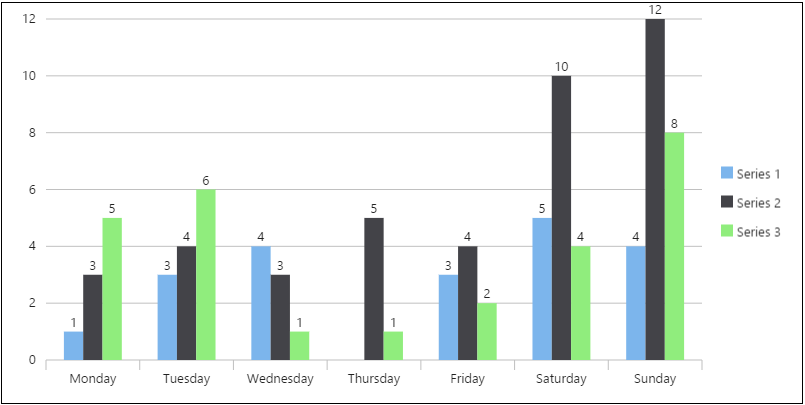
Bar
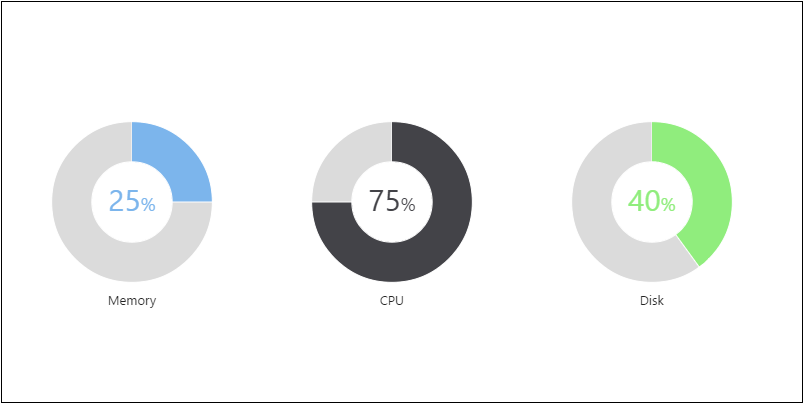
Gauge
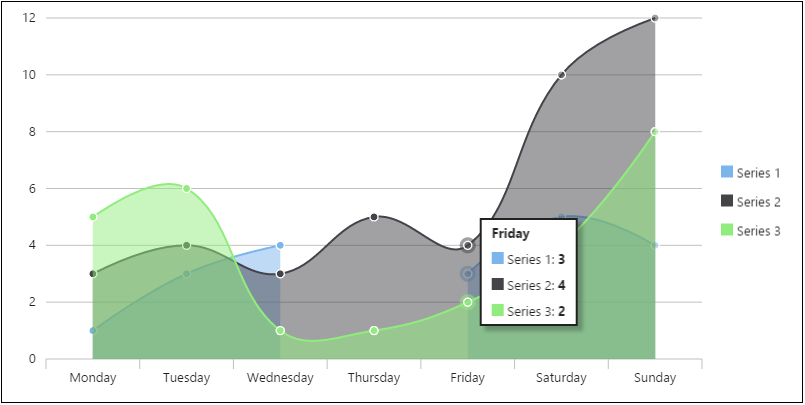
Line
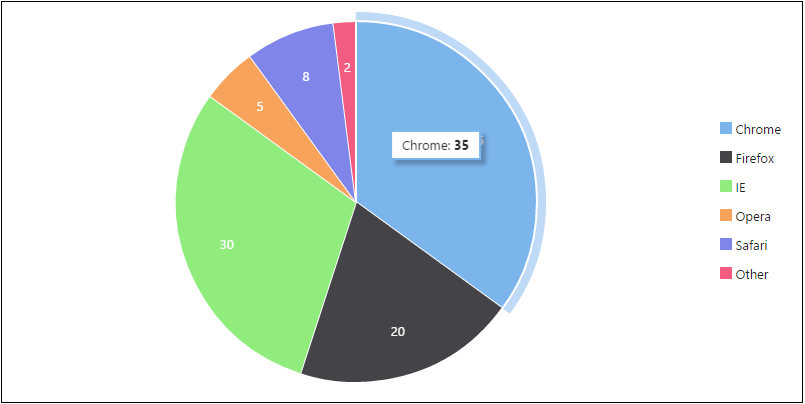
Pie
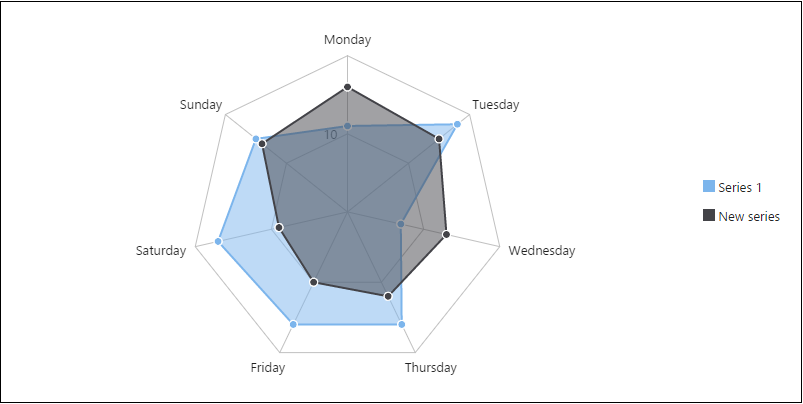
Radar
modern_charts combines Canvas and DOM to achieve the best performance and experience.
Data are passed to a chart via a DataTable object. By using DataTable, you
can flexibly modify the data even after the chart has been rendered.
Animations are supported for different types of data modifications:
Charts automatically resize when the browser is resized.
Each chart type has its own class, so your final production code only contains the code of the chart types you use.
Please read the wiki for instructions on how to use these beautiful charts.
依存関係一覧 4 件
>=0.15.7anyanyany用途で絞り込み、開発状況を比較し、採用前に元のリポジトリで要件を確認しましょう。
“A repository is the most basic element of GitHub.”
GitHub Docs — About repositories ↗