

v0.1.0
flutter_circular_chart
Flutter用のアニメーション付きラジアルチャートとパイチャート
91いいね 28230日間ダウンロード20Pub ポイント
プラットフォーム情報なし
Flutter用のアニメーション付きラジアルチャートとパイチャート

以下は英語原文のスナップショットです。最新版は GitHub をご覧ください。

A library for creating animated circular chart widgets with Flutter, inspired by Zero to One with Flutter.
Create easily animated pie charts and radial charts by providing them with data objects they can plot into charts and animate between.

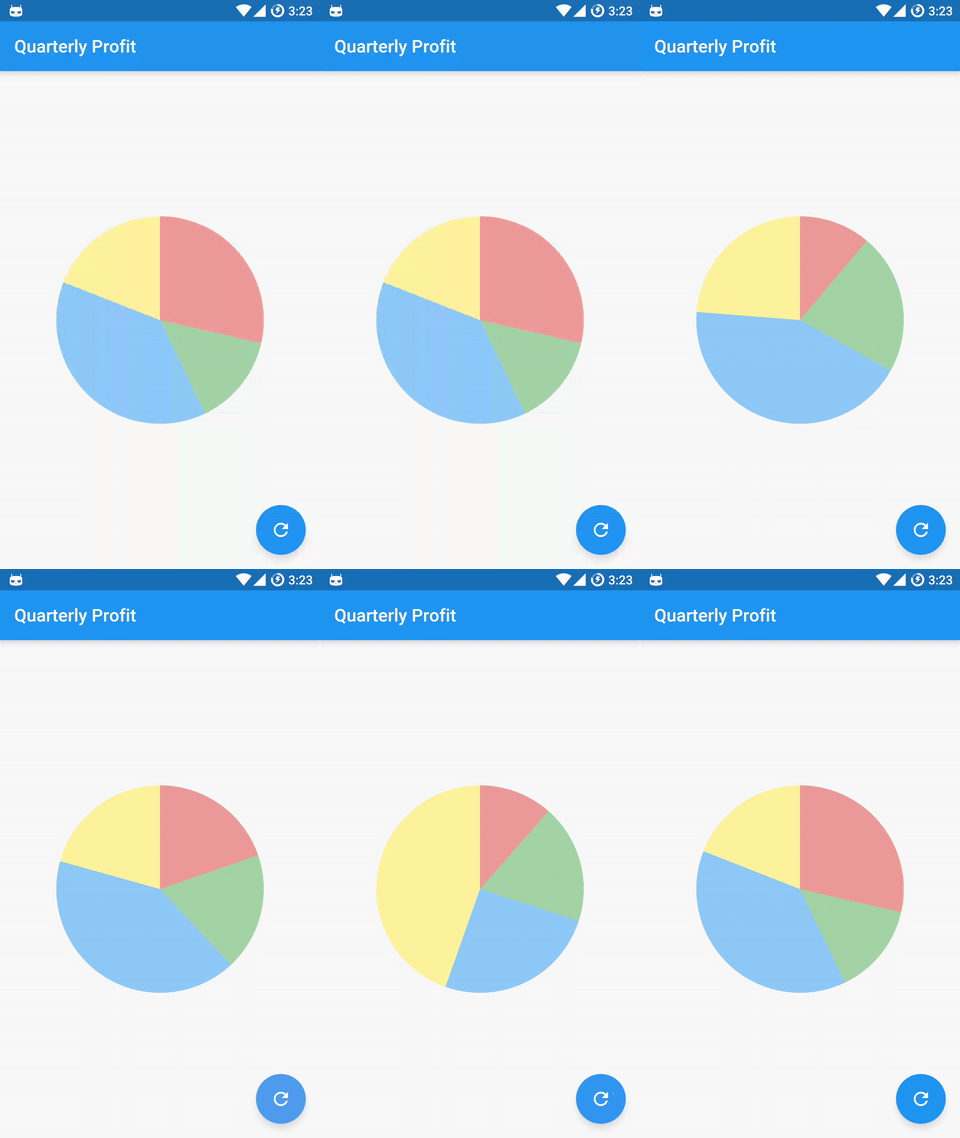

Check the examples folder for the source code for the above screenshots.
Install the latest version from pub.
Import the package:
import 'package:flutter_circular_chart/flutter_circular_chart.dart';
Create a GlobalKey to be able to access the chart and update its data:
final GlobalKey<AnimatedCircularChartState> _chartKey = new GlobalKey<AnimatedCircularChartState>();
Create chart data entry objects:
List<CircularStackEntry> data = <CircularStackEntry>[
  new CircularStackEntry(
    <CircularSegmentEntry>[
      new CircularSegmentEntry(500.0, Colors.red[200], rankKey: 'Q1'),
      new CircularSegmentEntry(1000.0, Colors.green[200], rankKey: 'Q2'),
      new CircularSegmentEntry(2000.0, Colors.blue[200], rankKey: 'Q3'),
      new CircularSegmentEntry(1000.0, Colors.yellow[200], rankKey: 'Q4'),
    ],
    rankKey: 'Quarterly Profits',
  ),
];
Create an AnimatedCircularChart, passing it the _chartKey and initial data:
@override
Widget build(BuildContext context) {
  return new AnimatedCircularChart(
    key: _chartKey,
    size: const Size(300.0, 300.0),
    initialChartData: data,
    chartType: CircularChartType.Pie,
  );
}
Call updateData to animate the chart:
void _cycleSamples() {
  List<CircularStackEntry> nextData = <CircularStackEntry>[
    new CircularStackEntry(
      <CircularSegmentEntry>[
        new CircularSegmentEntry(1500.0, Colors.red[200], rankKey: 'Q1'),
        new CircularSegmentEntry(750.0, Colors.green[200], rankKey: 'Q2'),
        new CircularSegmentEntry(2000.0, Colors.blue[200], rankKey: 'Q3'),
        new CircularSegmentEntry(1000.0, Colors.yellow[200], rankKey: 'Q4'),
      ],
      rankKey: 'Quarterly Profits',
    ),
  ];
  setState(() {
    _chartKey.currentState.updateData(nextData);
  });
}
| Property | Default |
|---|---|
| holeLabel | null |
| labelStyle | Theme.of(context).textTheme.body2 |
Example:
new AnimatedCircularChart(
  key: _chartKey,
  size: _chartSize,
  initialChartData: <CircularStackEntry>[
    new CircularStackEntry(
      <CircularSegmentEntry>[
        new CircularSegmentEntry(
          33.33,
          Colors.blue[400],
          rankKey: 'completed',
        ),
        new CircularSegmentEntry(
          66.67,
          Colors.blueGrey[600],
          rankKey: 'remaining',
        ),
      ],
      rankKey: 'progress',
    ),
  ],
  chartType: CircularChartType.Radial,
  percentageValues: true,
  holeLabel: '1/3',
  labelStyle: new TextStyle(
    color: Colors.blueGrey[600],
    fontWeight: FontWeight.bold,
    fontSize: 24.0,
  ),
)

| Property | Default |
|---|---|
| edgeStyle | SegmentEdgeStyle.flat |
| SegmentEdgeStyle | Description |
|---|---|
| flat (default) | Segments begin and end with a flat edge. |
| round | Segments begin and end with a semi-circle. |
Example:
new AnimatedCircularChart(
  key: _chartKey,
  size: _chartSize,
  initialChartData: <CircularStackEntry>[
    new CircularStackEntry(
      <CircularSegmentEntry>[
        new CircularSegmentEntry(
          33.33,
          Colors.blue[400],
          rankKey: 'completed',
        ),
        new CircularSegmentEntry(
          66.67,
          Colors.blueGrey[600],
          rankKey: 'remaining',
        ),
      ],
      rankKey: 'progress',
    ),
  ],
  chartType: CircularChartType.Radial,
  edgeStyle: SegmentEdgeStyle.round,
  percentageValues: true,
)

Charts expect a list of CircularStackEntry objects containing the data they need to be drawn.
Each CircularStackEntry corresponds to a complete circle in the chart. For radial charts that is one of the rings, for pie charts it is the whole pie.
Radial charts with multiple CircularStackEntrys will display them as concentric circles.
Each CircularStackEntry is composed of multiple CircularSegmentEntrys containing the value of a data point. In radial charts a segment corresponds to an arc segment of the current ring, for pie charts it is an individual slice.
依存関係一覧 2 件
{"sdk":"flutter"}{"sdk":"flutter"}用途で絞り込み、開発状況を比較し、採用前に元のリポジトリで要件を確認しましょう。
“A repository is the most basic element of GitHub.”
GitHub Docs — About repositories ↗