
 v0.0.13
progress_bar_chart
진행률 표시기와 애니메이션을 사용하여 수직 차트에 여러 값을 표시하는 패키지입니다.
14좋아요 34530일 다운로드145Pub 점수
AndroidiOSWebmacOSWindowsLinux
진행률 표시기와 애니메이션을 사용하여 수직 차트에 여러 값을 표시하는 패키지입니다.
아래는 영문 원문 스냅샷입니다. 최신 내용은 GitHub에서 확인하세요.
A package to display multipe values on a vertical chart using progess indicators and animation. Each value can has a color .
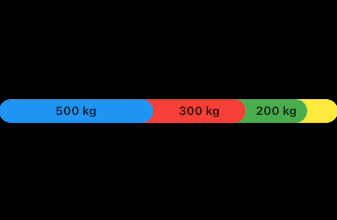
| Example 1 | Example 2 |
|---|---|
 |
 |
Example 1:
final List<StatisticsItem> stats = [
  StatisticsItem(Colors.blue, 500, title: 'Type 1'),
  StatisticsItem(Colors.green, 200, title: 'Type 2'),
  StatisticsItem(Colors.red, 300, title: 'Type 3'),
  StatisticsItem(Colors.yellow, 100, title: 'Type 4'),
];

ProgressBarChart(
    values: stats,
    height: 30,
    borderRadius: 20,
    totalPercentage: 1100,
    unitLabel: 'kg',
),
Example 2:
final List<StatisticsItem> stats = [
  StatisticsItem(Colors.blue, 0.4),
  StatisticsItem(Colors.green, 0.3),
  StatisticsItem(Colors.red, 0.2),
  StatisticsItem(Colors.yellow, 0.1),
];

ProgressBarChart(
  values: stats,
  height: 30,
  borderRadius: 20,
),
Without labels and colorblend:
final List<StatisticsItem> stats = [
  StatisticsItem(Colors.blue, 0.4),
  StatisticsItem(Colors.green, 0.3),
  StatisticsItem(Colors.red, 0.2),
  StatisticsItem(Colors.yellow, 0.1),
];

ProgressBarChart(
  values: stats,
  height: 30,
  borderRadius: 20,
  showLables: false,
  colorBlend: false,
)

의존성 목록 5 개
{"sdk":"flutter"}^0.20.2^4.5.0{"sdk":"flutter"}^4.0.0사용 목적에 따라 검색하고 개발 활동을 비교한 뒤 원본 저장소에서 요구 사항을 확인하세요.
“A repository is the most basic element of GitHub.”
GitHub Docs — About repositories ↗