

 v5.4.0
pie_chart
아름다운 파이 차트를 만들고 멋진 애니메이션을 제공하는 Flutter 패키지입니다.
440좋아요 3.1만30일 다운로드140Pub 점수
AndroidiOSWebmacOSWindowsLinux
애니메이션을 사용한 플러터 파이 차트

아래는 영문 원문 스냅샷입니다. 최신 내용은 GitHub에서 확인하세요.


This Flutter package provides a Pie Chart Widget with cool animation.
More discussions on Discord: https://discord.gg/7byeCn7MGF
Live Demo: https://apgapg.github.io/pie_chart/

In the dependencies: section of your pubspec.yaml, add the following line:

dependencies:
  pie_chart: <latest version>
import 'package:pie_chart/pie_chart.dart';
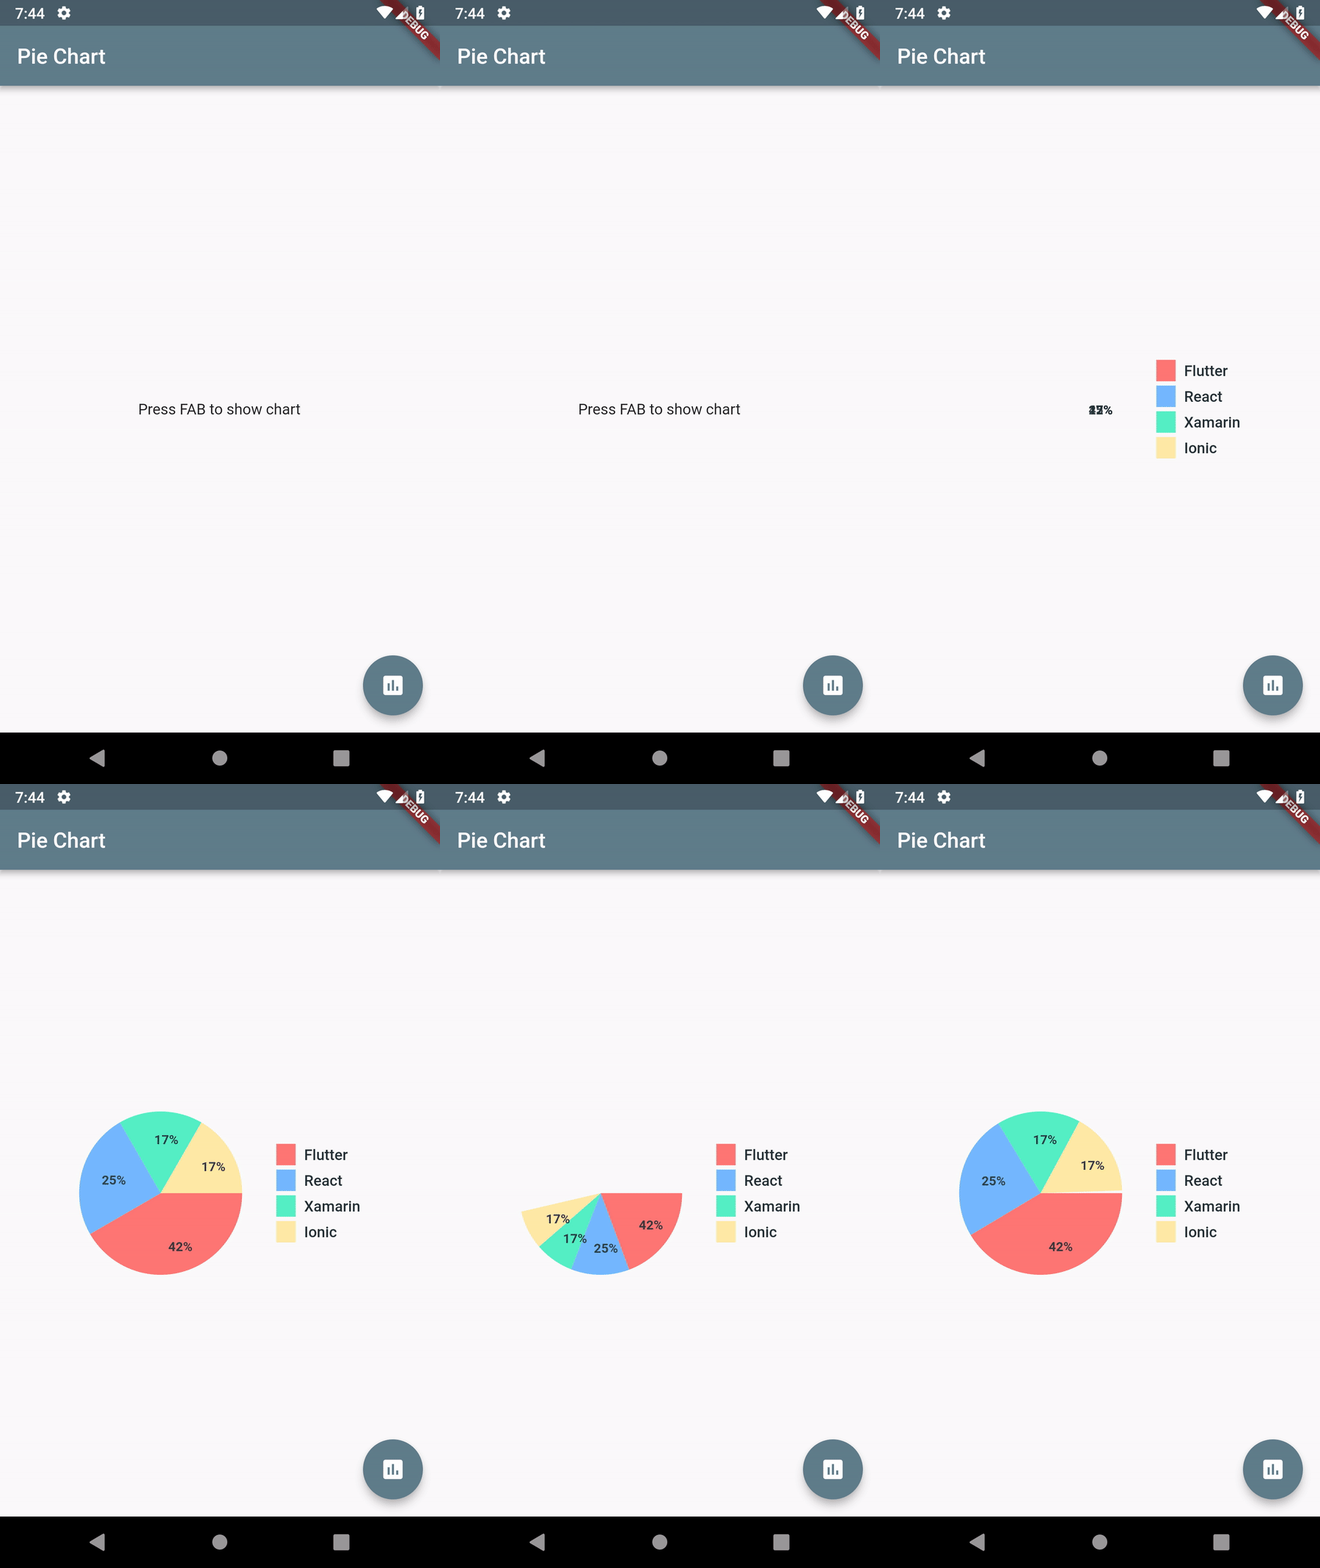
Map<String, double> dataMap = {
    "Flutter": 5,
    "React": 3,
    "Xamarin": 2,
    "Ionic": 2,
  };
PieChart(dataMap: dataMap)
PieChart(
      dataMap: dataMap,
      animationDuration: Duration(milliseconds: 800),
      chartLegendSpacing: 32,
      chartRadius: MediaQuery.of(context).size.width / 3.2,
      colorList: colorList,
      initialAngleInDegree: 0,
      chartType: ChartType.ring,
      ringStrokeWidth: 32,
      centerText: "HYBRID",
      legendOptions: LegendOptions(
        showLegendsInRow: false,
        legendPosition: LegendPosition.right,
        showLegends: true,
        legendShape: _BoxShape.circle,
        legendTextStyle: TextStyle(
          fontWeight: FontWeight.bold,
        ),
      ),
      chartValuesOptions: ChartValuesOptions(
        showChartValueBackground: true,
        showChartValues: true,
        showChartValuesInPercentage: false,
        showChartValuesOutside: false,
        decimalPlaces: 1,
      ),
      // gradientList: ---To add gradient colors---
      // emptyColorGradient: ---Empty Color gradient---
    )
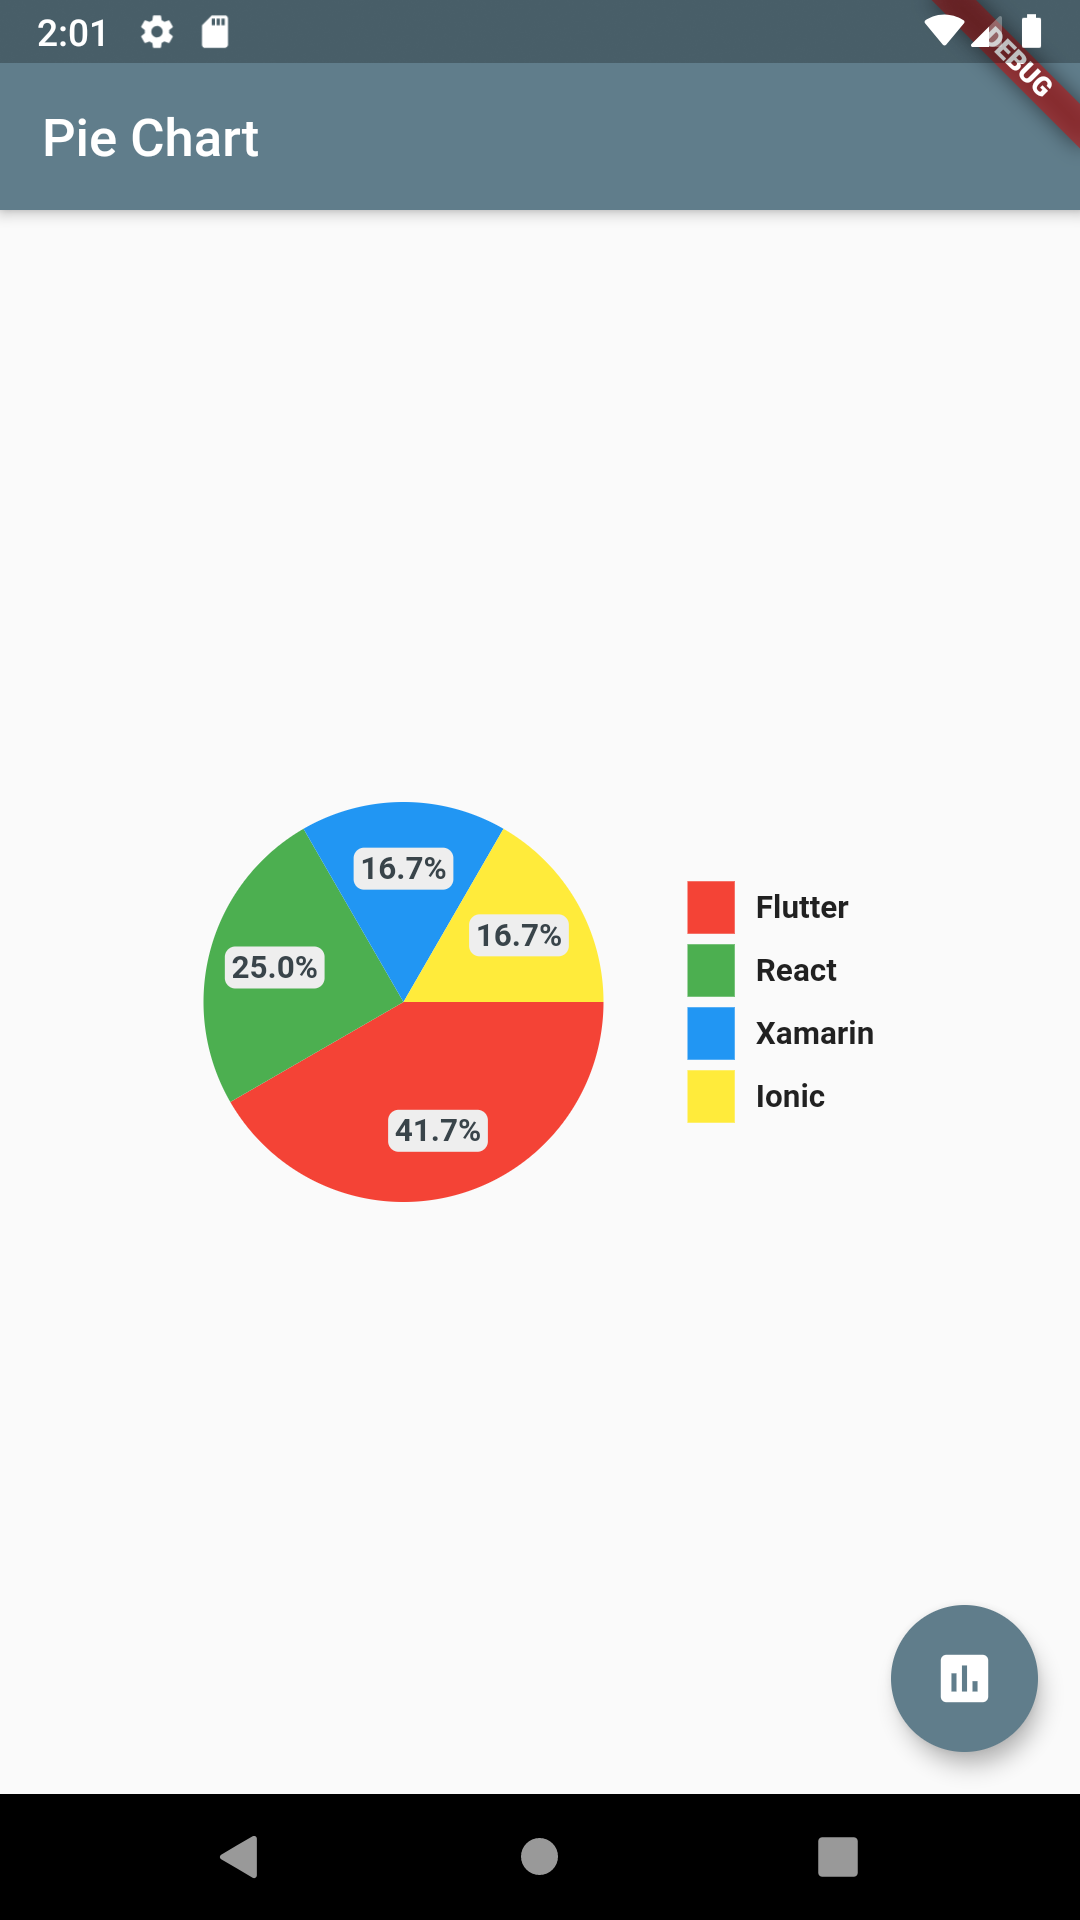
chartValuesOptions: ChartValuesOptions(
  decimalPlaces: 1,
),
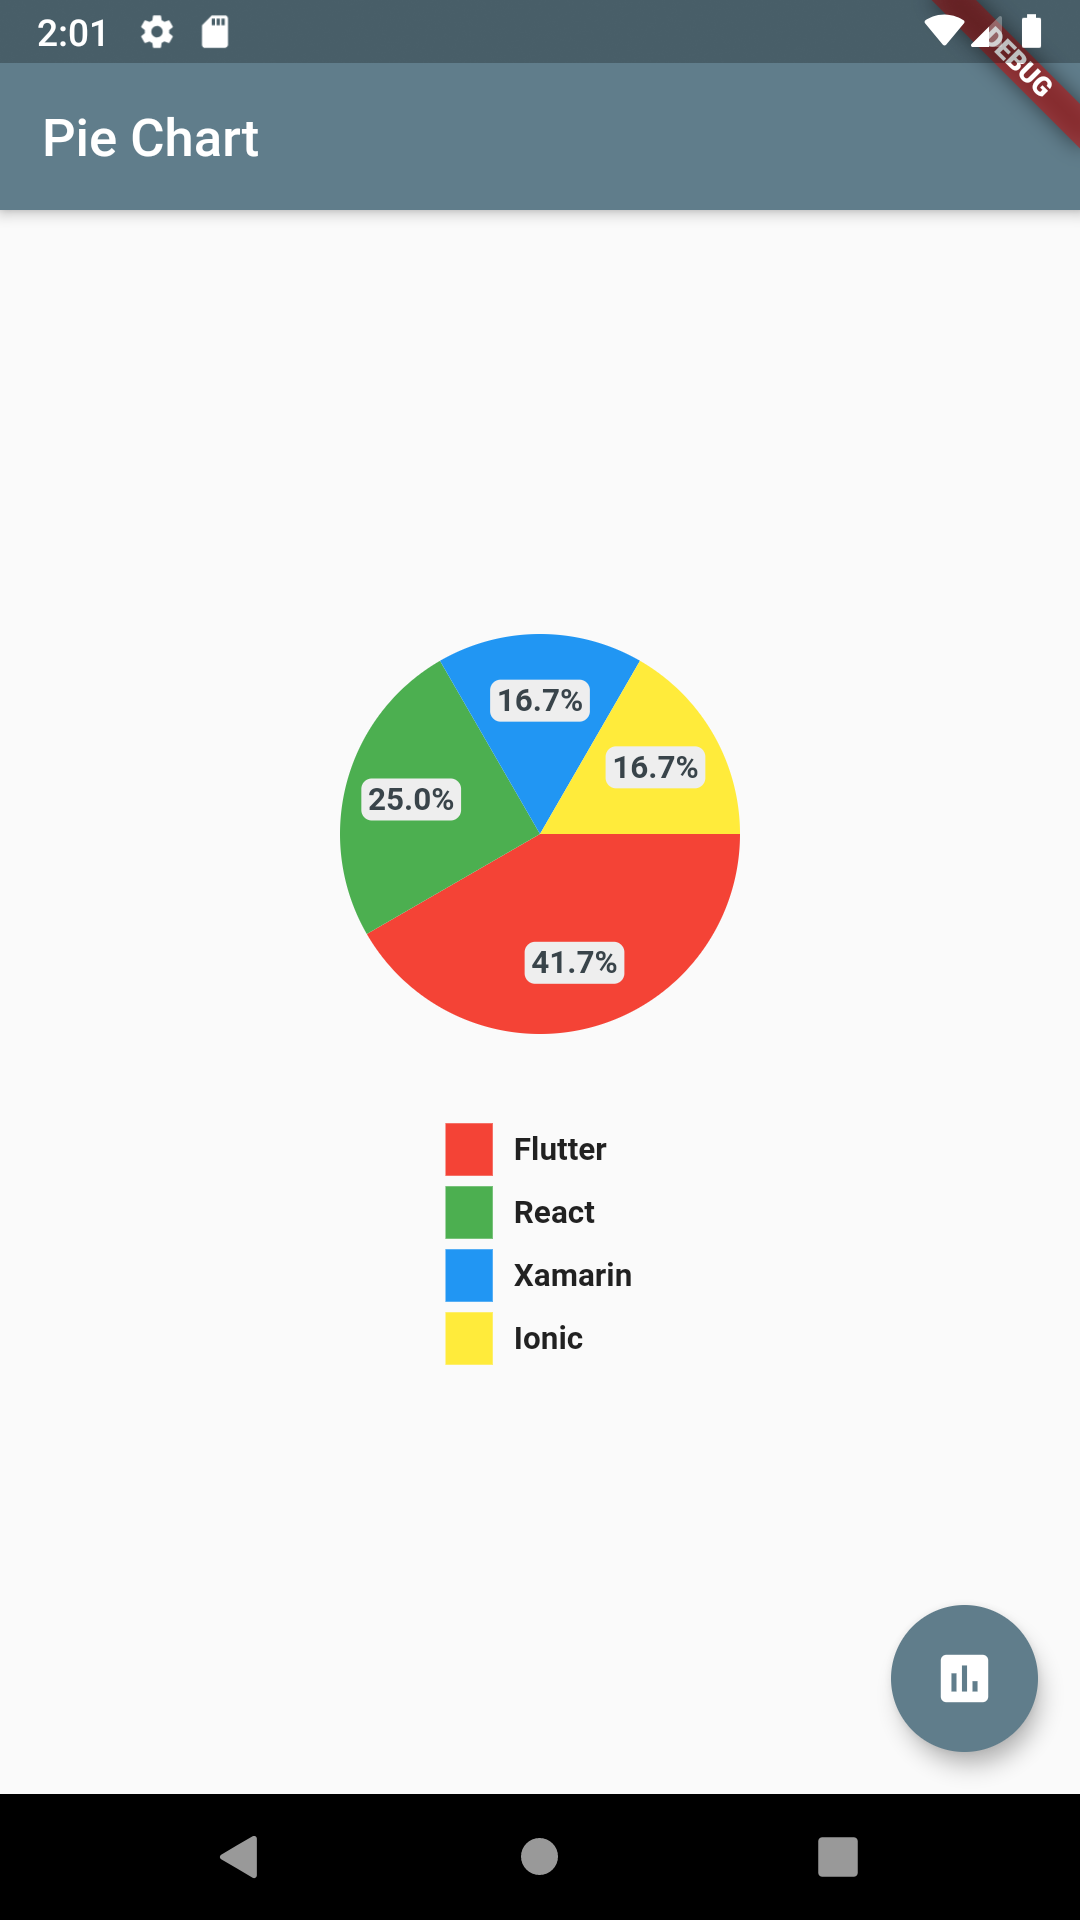
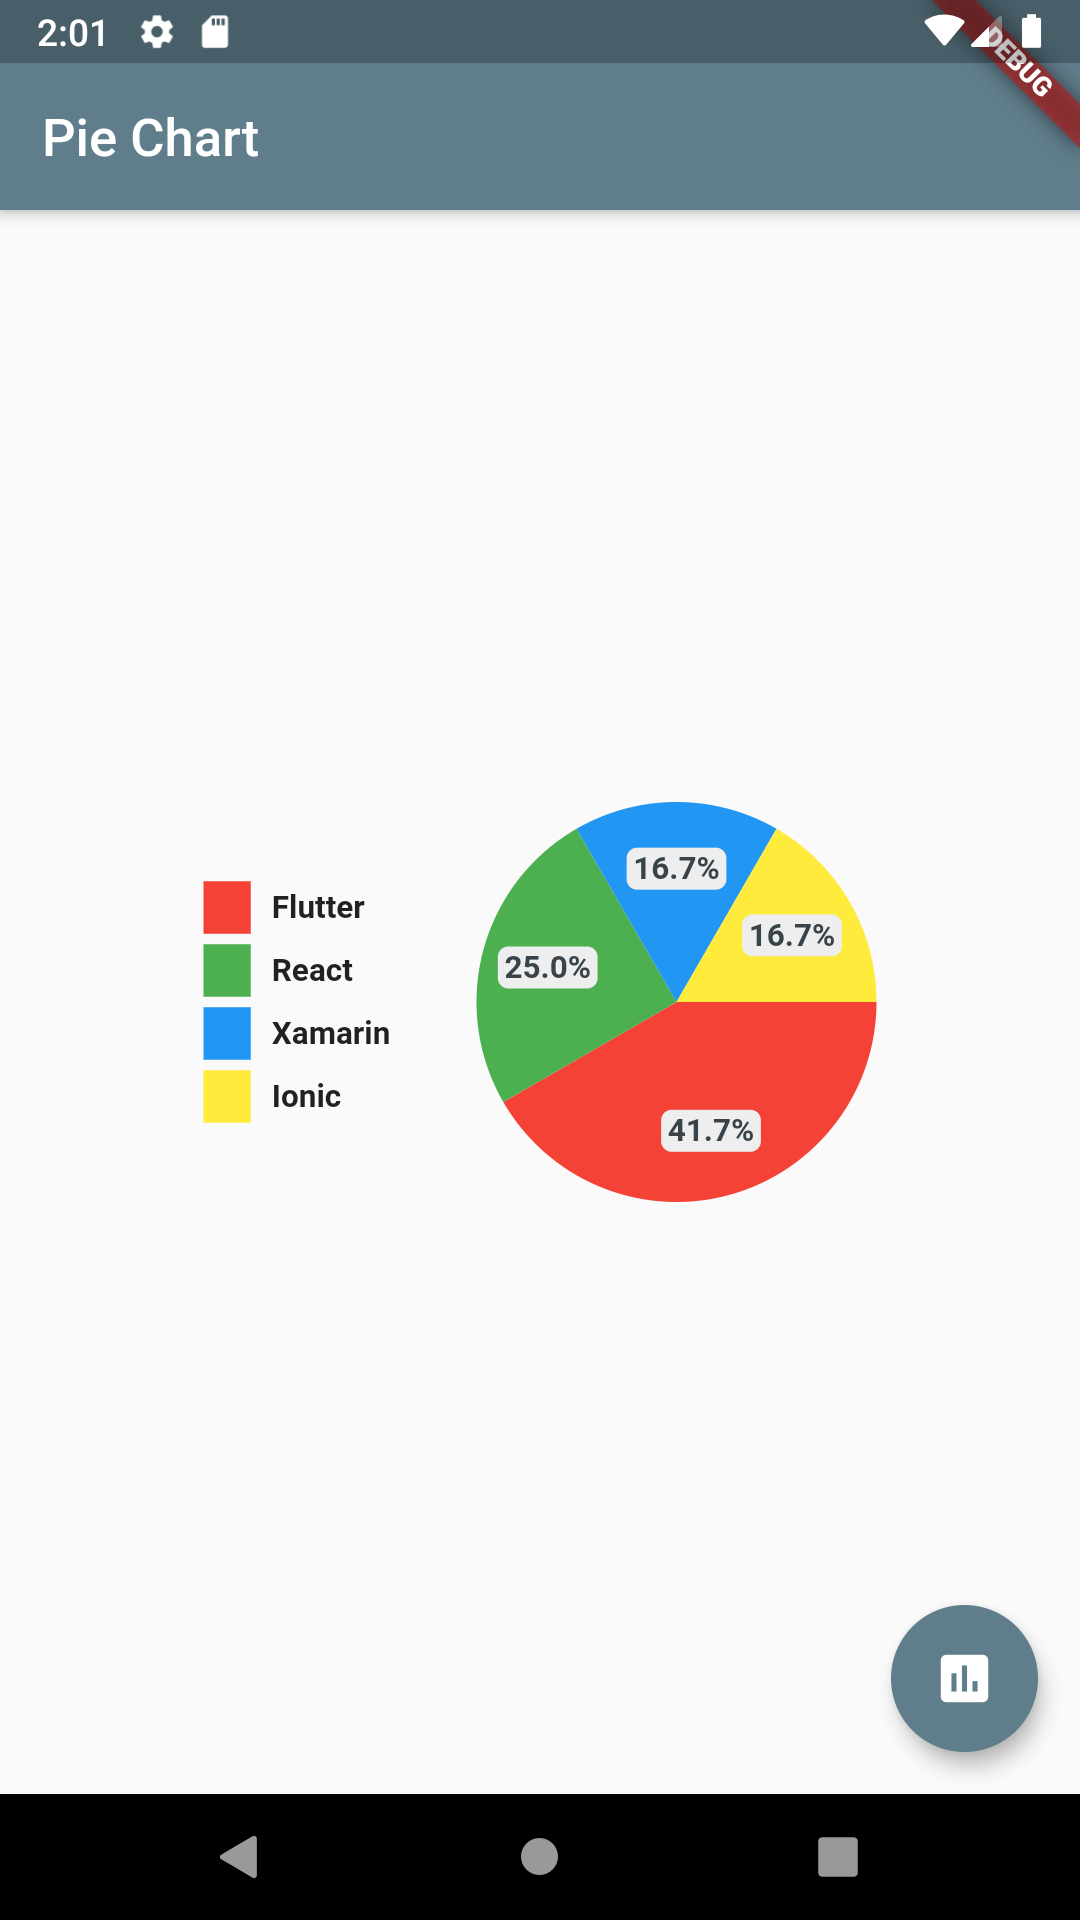
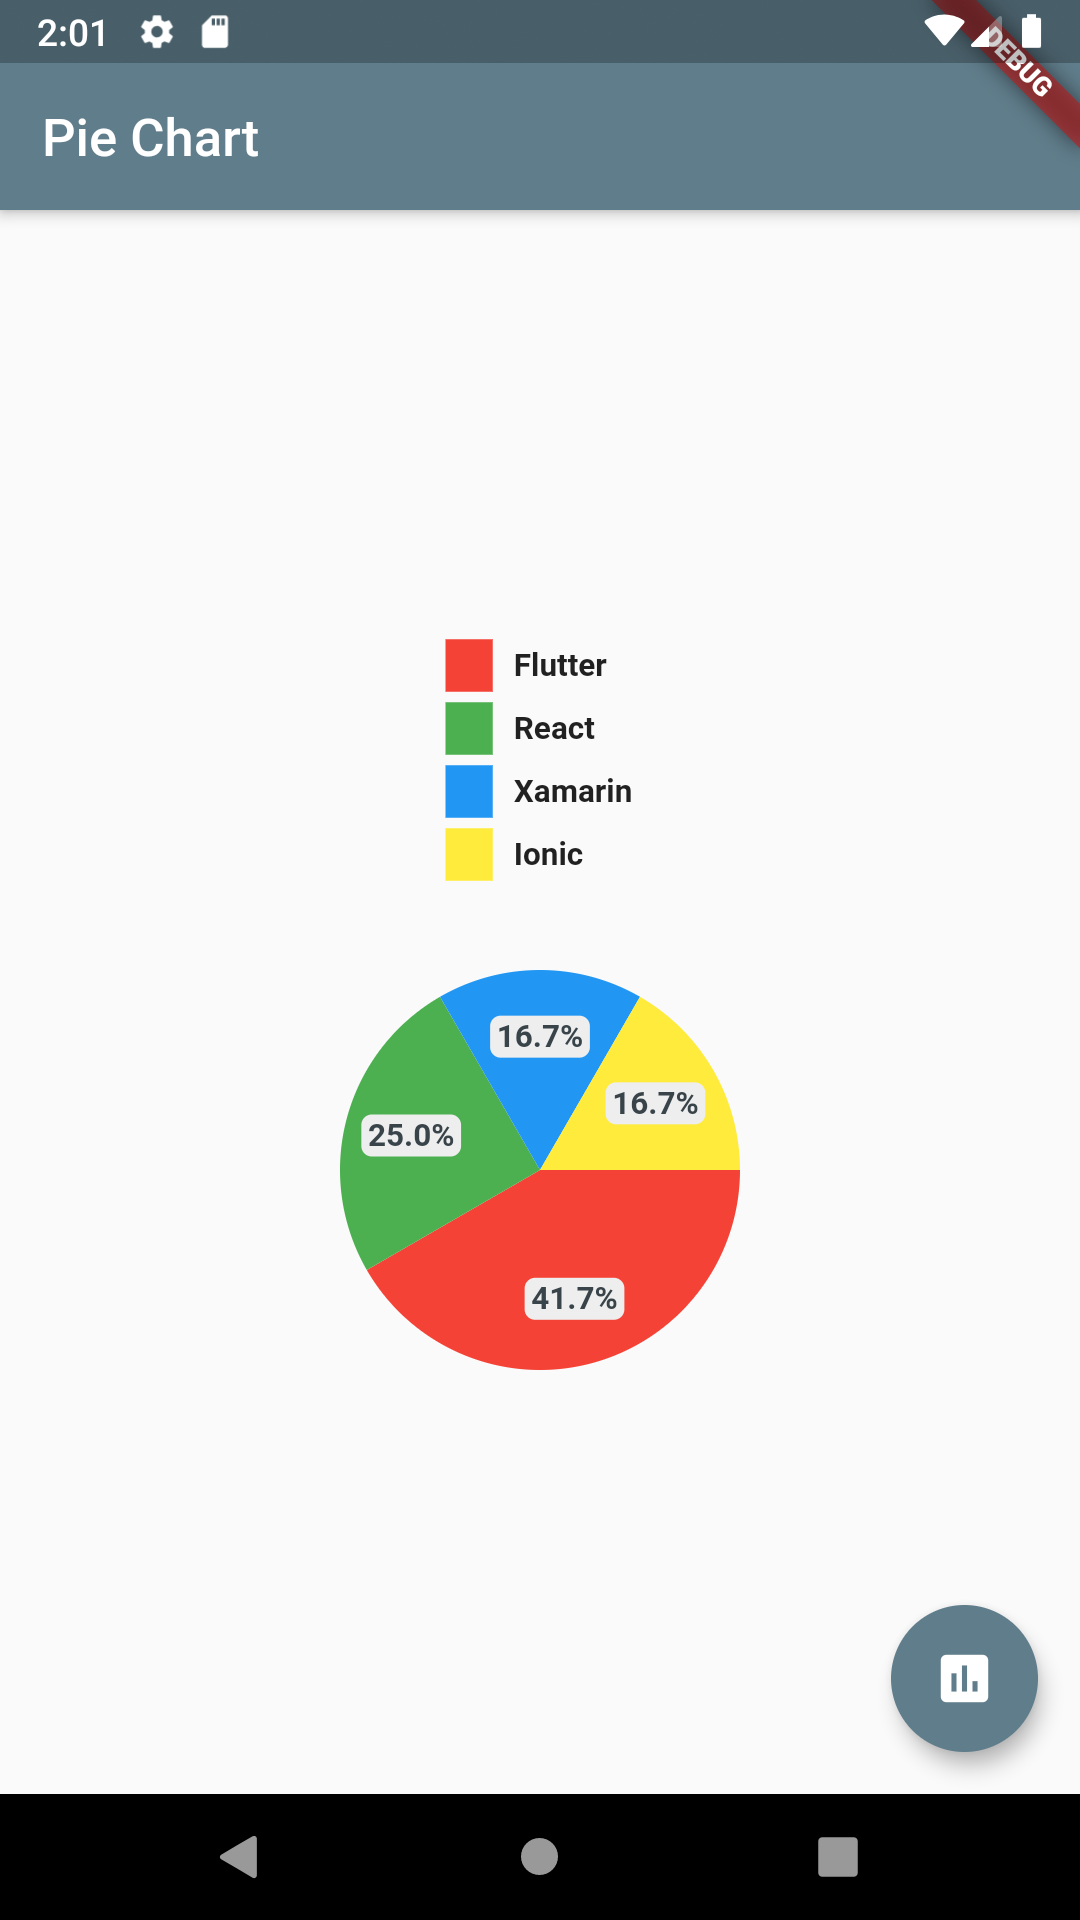
chartType: ChartType.ring,
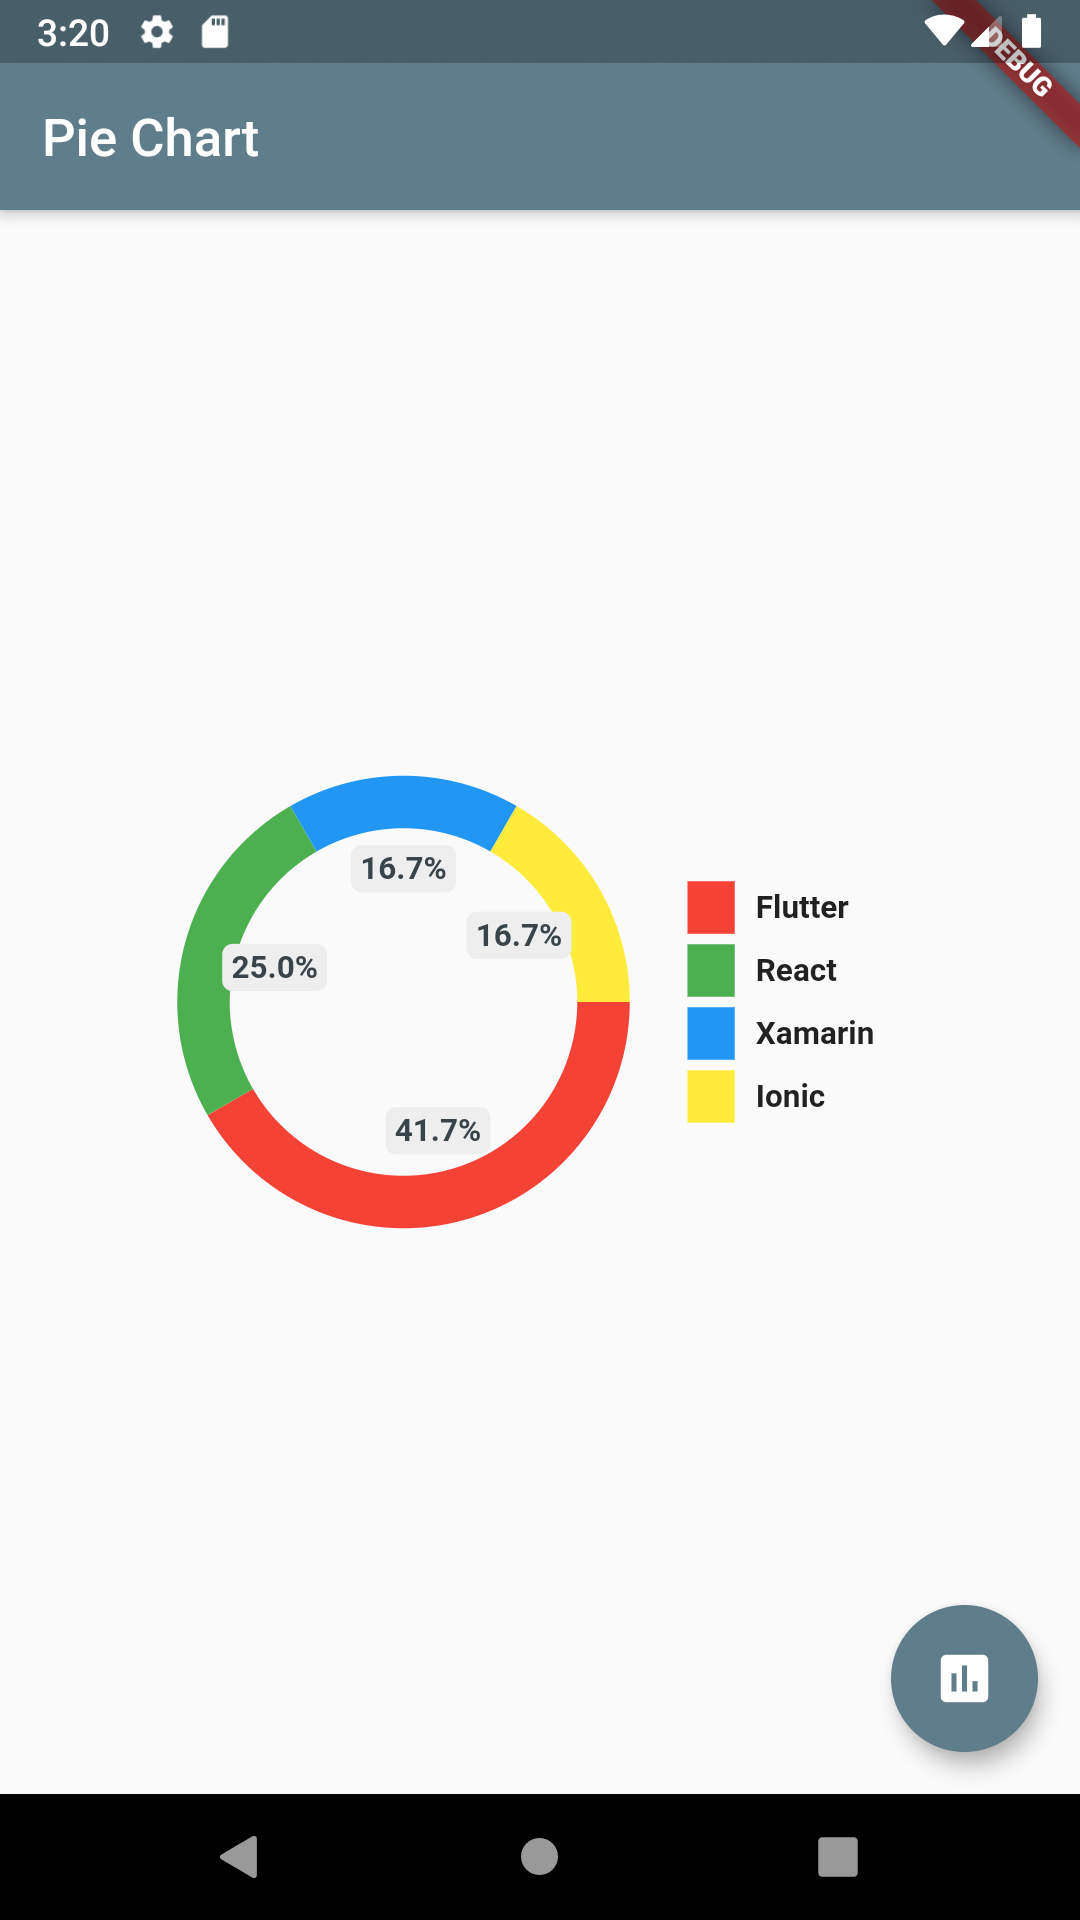
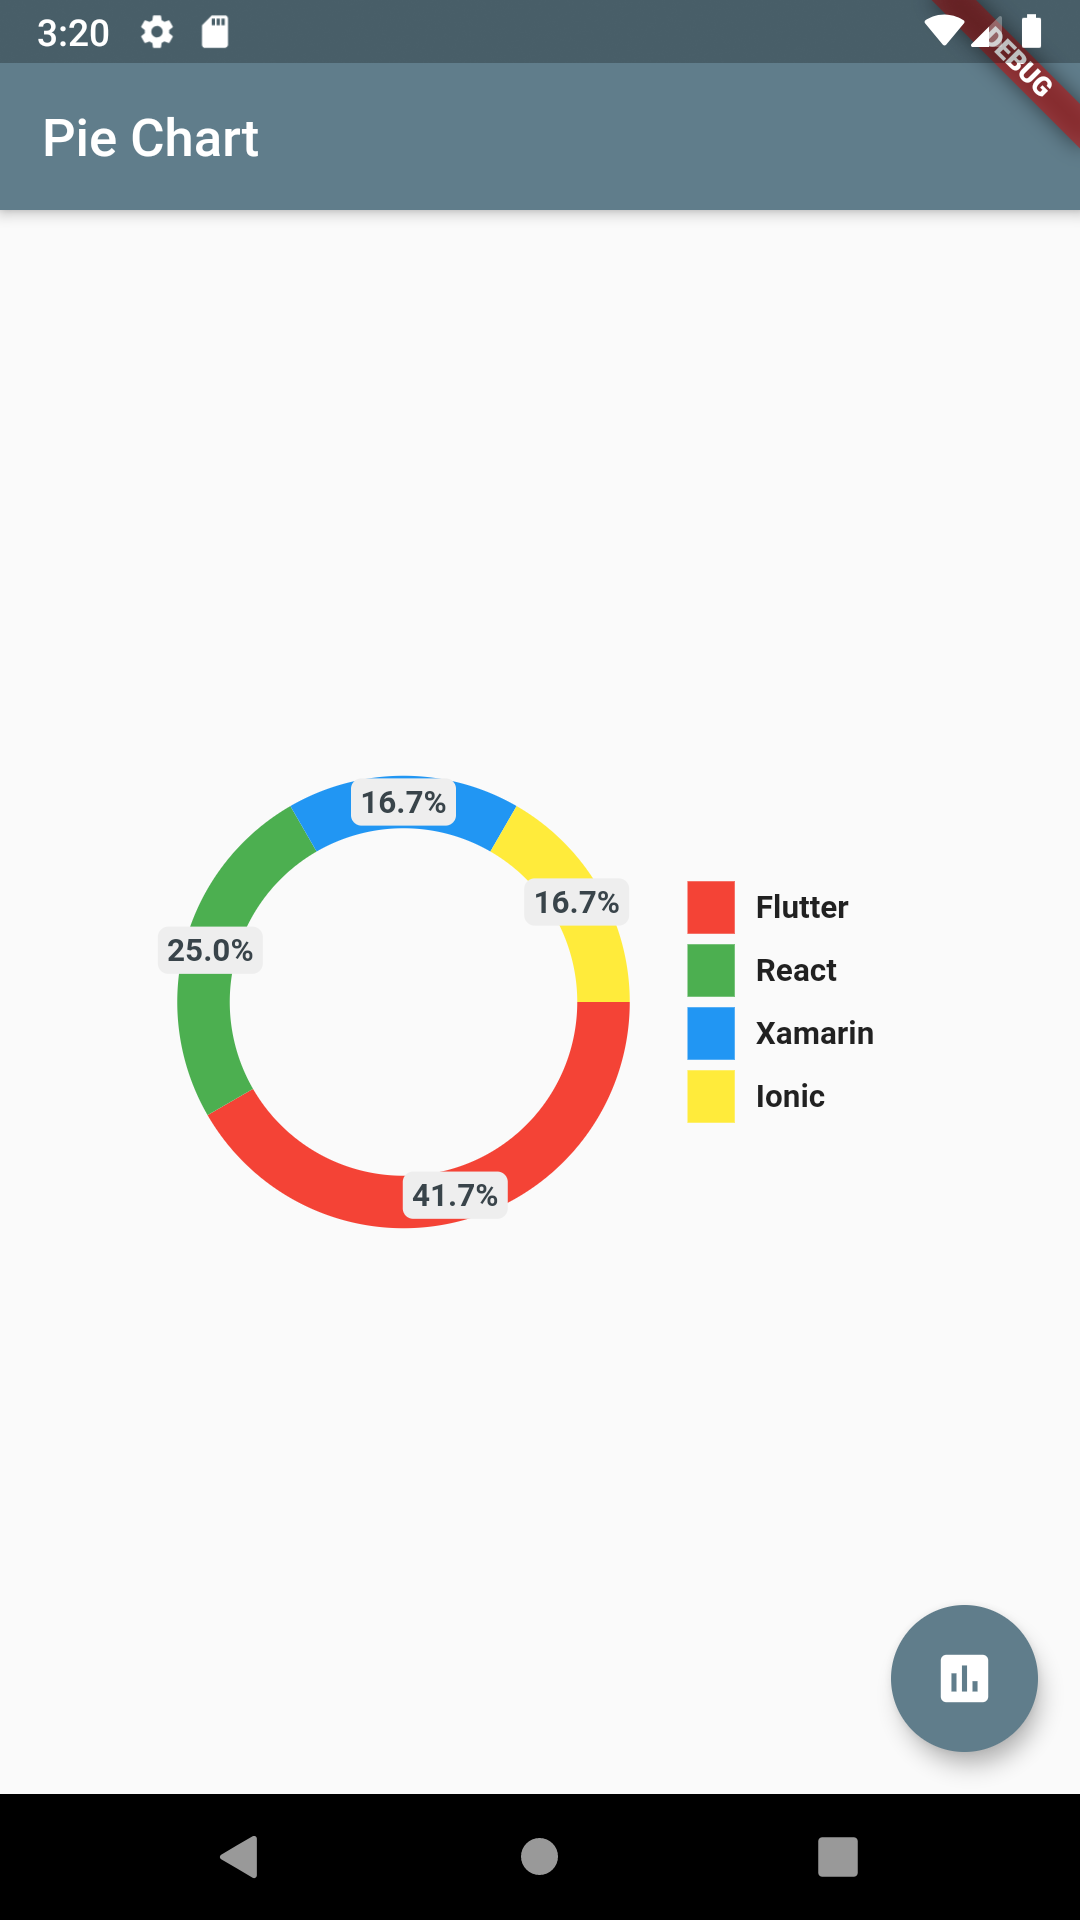
chartType: ChartType.ring,
showChartValuesOutside: true,
Pie Chart supports gradient as colors. Just pass gradientList instead of colorList to add gradient to chart colors.
final gradientList = <List<Color>>[
  [
    Color.fromRGBO(223, 250, 92, 1),
    Color.fromRGBO(129, 250, 112, 1),
  ],
  [
    Color.fromRGBO(129, 182, 205, 1),
    Color.fromRGBO(91, 253, 199, 1),
  ],
  [
    Color.fromRGBO(175, 63, 62, 1.0),
    Color.fromRGBO(254, 154, 92, 1),
  ]
];

// Pass gradient to PieChart
gradientList: gradientList,
emptyColorGradient: [
 Color(0xff6c5ce7),
 Colors.blue,
],
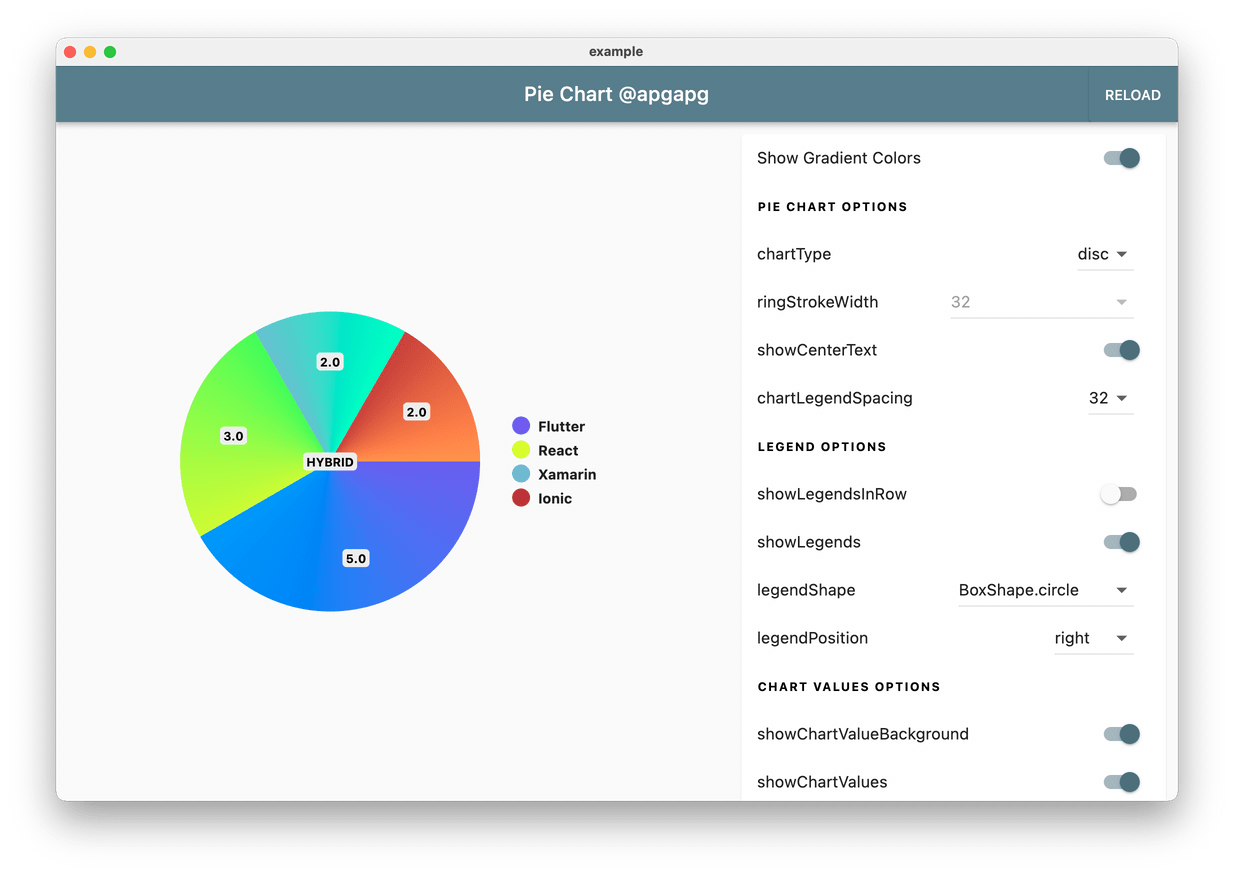
Add a base pie-chart color via:
baseChartColor: Colors.grey
Full code:
class HomePage2 extends StatelessWidget {
  HomePage2({Key? key}) : super(key: key);

  final dataMap = <String, double>{
    "Flutter": 5,
  };

  final colorList = <Color>[
    Colors.greenAccent,
  ];

  @override
  Widget build(BuildContext context) {
    return Scaffold(
      appBar: AppBar(
        title: Text("Pie Chart 1"),
      ),
      body: Container(
        padding: EdgeInsets.symmetric(horizontal: 16),
        child: PieChart(
          dataMap: dataMap,
          chartType: ChartType.ring,
          baseChartColor: Colors.grey[300]!,
          colorList: colorList,
        ),
      ),
    );
  }
}
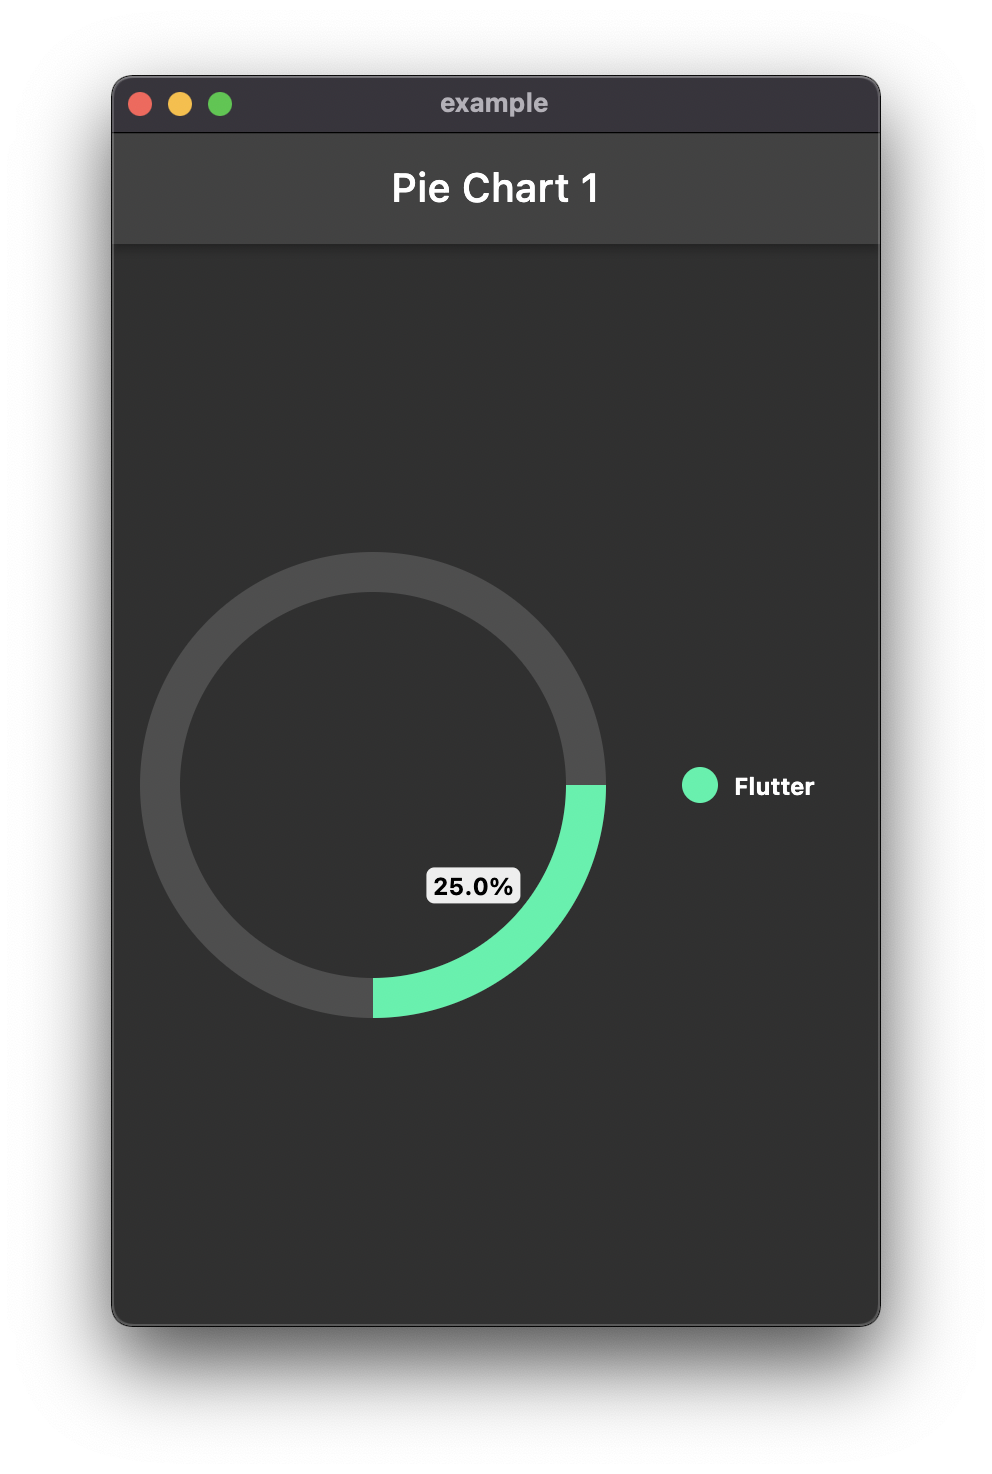
To show chart arcs based on your total value, add totalValue option.
class HomePage2 extends StatelessWidget {
  HomePage2({Key? key}) : super(key: key);

  final dataMap = <String, double>{
    "Flutter": 5,
  };

  final colorList = <Color>[
    Colors.greenAccent,
  ];

  @override
  Widget build(BuildContext context) {
    return Scaffold(
      appBar: AppBar(
        title: Text("Pie Chart 1"),
      ),
      body: Container(
        padding: EdgeInsets.symmetric(horizontal: 16),
        child: PieChart(
          dataMap: dataMap,
          chartType: ChartType.ring,
          baseChartColor: Colors.grey[50]!.withOpacity(0.15),
          colorList: colorList,
          chartValuesOptions: ChartValuesOptions(
            showChartValuesInPercentage: true,
          ),
          totalValue: 20,
        ),
      ),
    );
  }
}
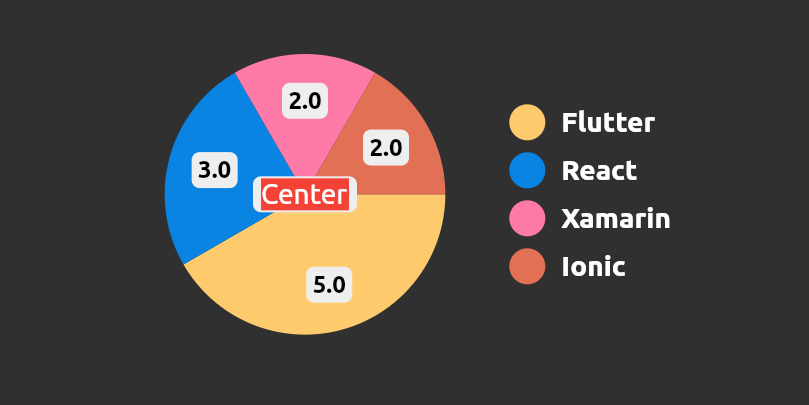
Creates a new widget placed at pie chart center
centerWidget: Container(color: Colors.red, child: const Text("Center"))
 Create Flutter Json Table from json map directly.
 Flutter Avatar Glow Widget with glowing animation.
 Flutter Search Widget for selecting an option from list.
 Flutter Animating Location Pin Widget providing Animating Location Pin Widget which can be used while fetching device location.
 Showcase My Portfolio: Ayush P Gupta on Playstore.
 Flutter App which allows reading/uploading short stories.
의존성 목록 3 개
{"sdk":"flutter"}{"sdk":"flutter"}^2.0.1사용 목적에 따라 검색하고 개발 활동을 비교한 뒤 원본 저장소에서 요구 사항을 확인하세요.
“A repository is the most basic element of GitHub.”
GitHub Docs — About repositories ↗