
 v1.0.1
chart_components
Flutter용 두 개의 차트 컴포넌트. GitHub 기반의 애니메이션 막대 차트 및 애니메이션 캘린더 그리드 차트. 사용자 정의 가능한 많은 속성.
49좋아요 6930일 다운로드70Pub 점수
플랫폼 정보 없음
Flutter용 애니메이션 바 차트 컴포넌트

{"sdk":"flutter"}{"sdk":"flutter"}아래는 영문 원문 스냅샷입니다. 최신 내용은 GitHub에서 확인하세요.
Customizable bar chart for Flutter. The component calculates min and max of data and resizes bars as needed.
bar chart
calendar grid
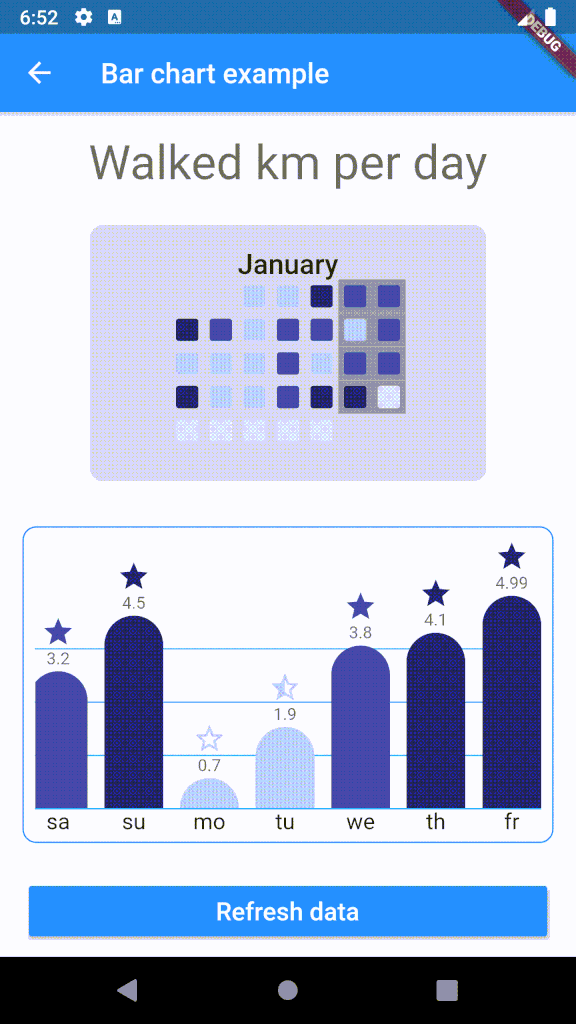
Demo:
To use plugin, just import package import 'package:chart_components/chart_components.dart';
Check de example directory to access the project that implements the image shown above.
        ........
                    CalendarGrid(
                            year: 2020,
                            month: 1,
                            getColorOfDay: DataRepository.getDayColor,
                            animationDuration: Duration(milliseconds: 1500),
                    ),

        ...........
                    child: BarChart(
                    data: data,
                    labels: labels,
                    dislplayValue: true,
                    reverse: true,
                    getColor: DataRepository.getColor,
                    getIcon: DataRepository.getIcon,
                    barWidth: 42,
                    barSeparation: 12,
                    animationDuration: Duration(milliseconds: 1800),
                    animationCurve: Curves.easeInOutSine,
                    itemRadius: 30,
                    iconHeight: 24,
                    footerHeight: 24,
                    headerValueHeight: 16,
                    roundValuesOnText: false,
                    lineGridColor: Colors.lightBlue,
                    ),