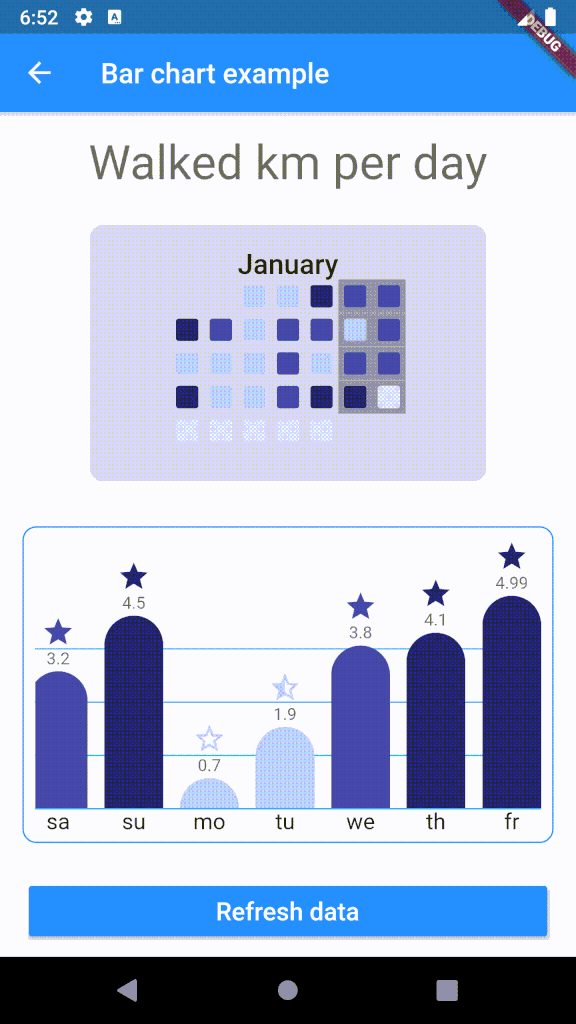
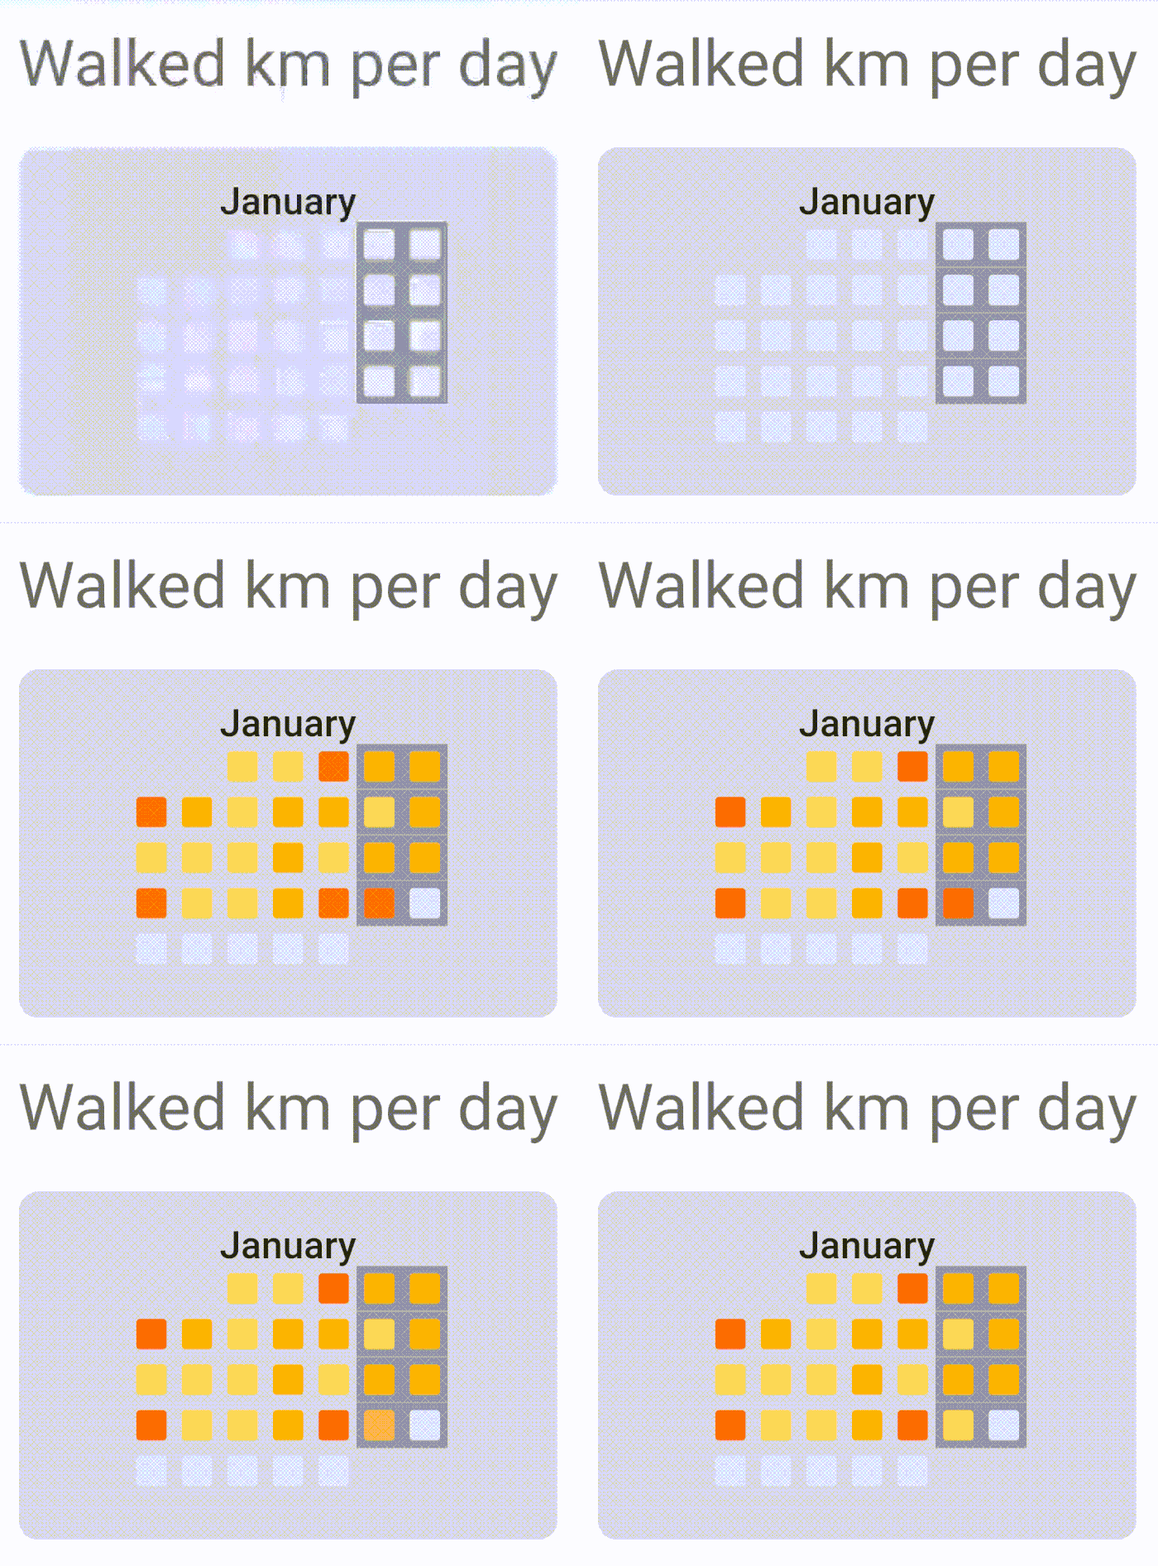
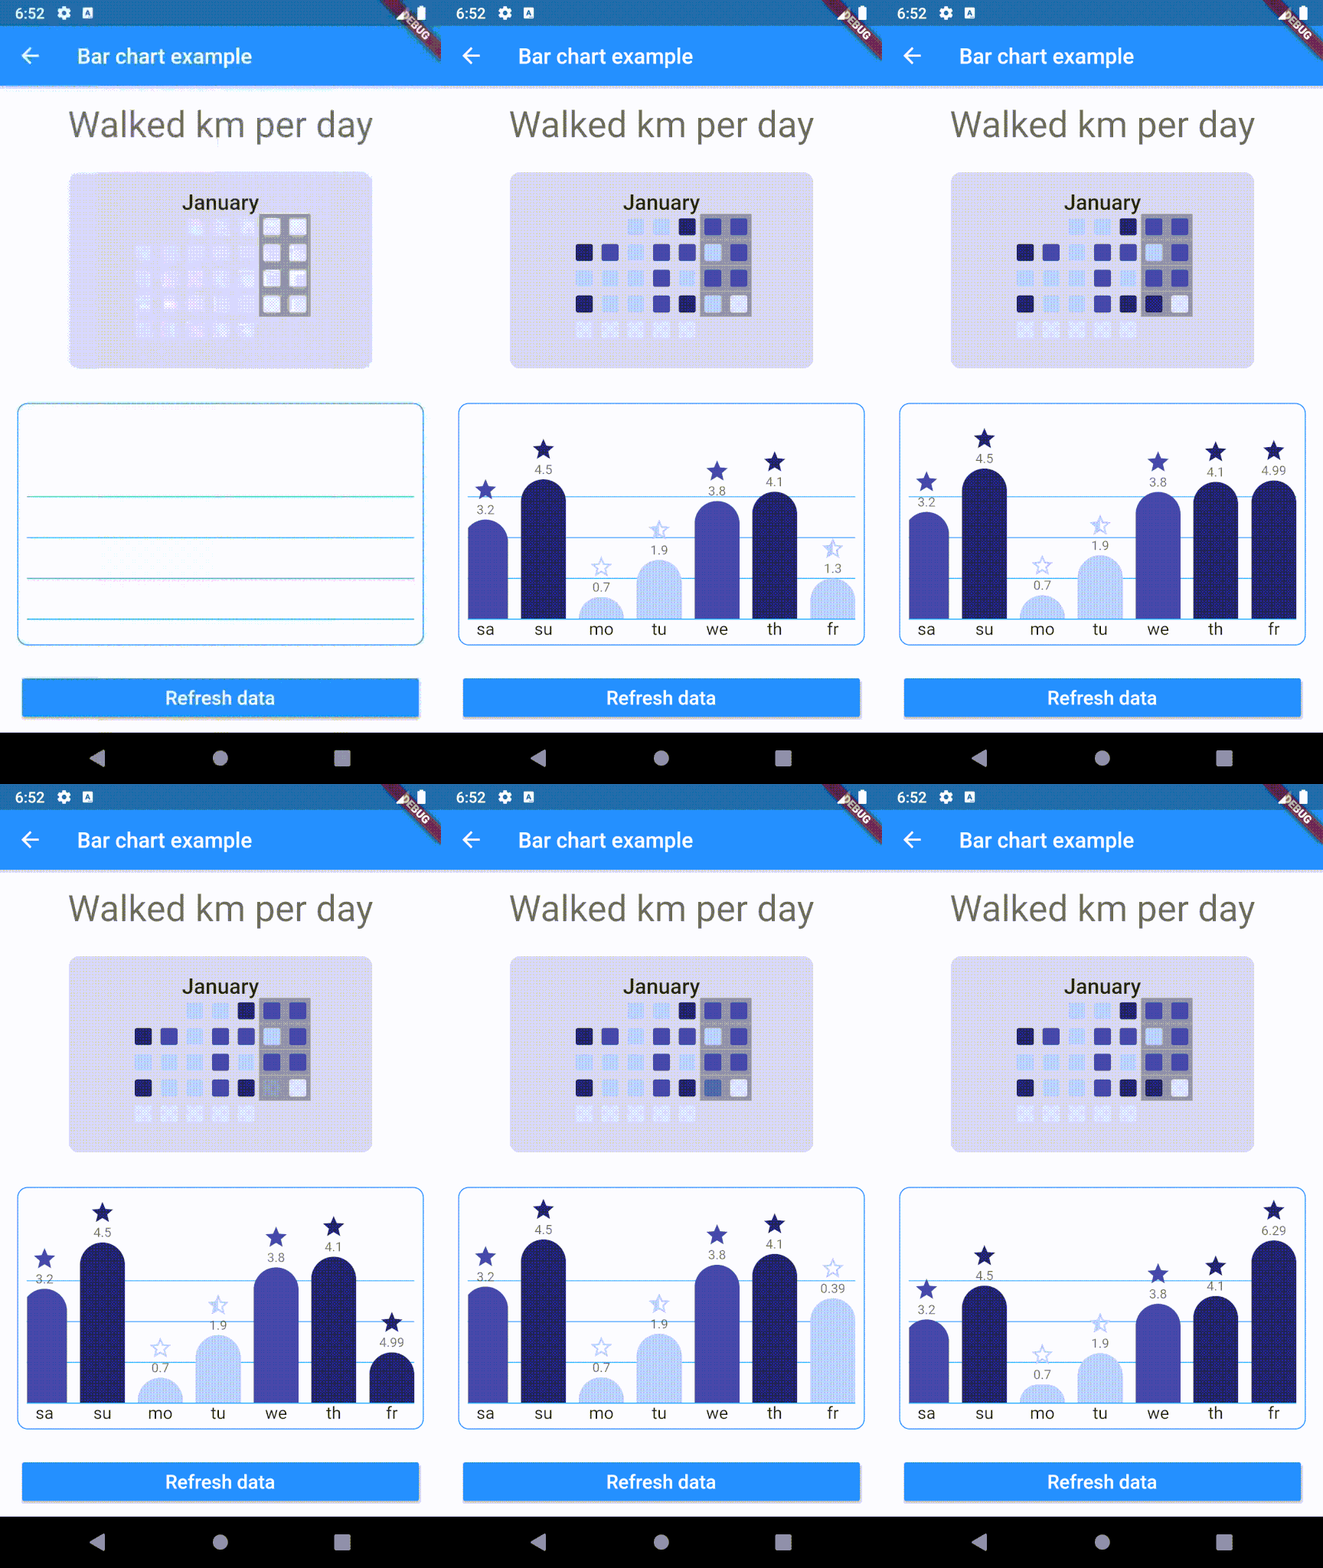
chart_components는 애니메이션 차트 위젯 두 가지를 제공하는 Flutter 패키지입니다: 애니메이션 막대 차트와 GitHub의 시각화 스타일을 영감으로 한 애니메이션 캘린더 그리드 차트입니다. 데이터 표현을 위해 설계되었으며, 수많은 구성 가능한 속성을 통해 광범위한 사용자 정의 옵션을 제공합니다. 시간 시리즈 데이터 또는 성능 지표를 부드러운 애니메이션으로 표시하는 데 이상적입니다. Flutter의 렌더링 엔진을 기반으로 구축되어, 대시보드 및 분석 인터페이스에 적합한 반응성 있고 시각적으로 매력적인 차트를 보장합니다.
사용 사례
시계열 데이터 표시
성능 지표 시각화
대시보드 위젯 만들기
분석 인터페이스 구축
활동 추세 표시
앱에서 데이터 표시 향상
주요 기능
애니메이션 막대 차트
애니메이션 캘린더 그리드 차트
풍부한 사용자 정의 옵션
부드러운 애니메이션
GitHub 스타일 디자인
반응형 레이아웃
적합한 대상
데이터 시각화 앱
대시보드 개발
분석 도구
활동 추적 기능
재사용 가능한 차트를 찾는 플러터 개발자
고려 사항
두 가지 차트 유형만 가능
내장된 데이터 변환 없음
수동 데이터 처리가 필요합니다
대규모 데이터 세트에 최적화되지 않음
서버 사이드 렌더링 지원 없음
외부 소스 코드에 의존
원본 README
연결된 소스 저장소의 README 원문 스냅샷입니다. 최신 내용은 저장소에서 확인하세요.
Chart_Components
Animated bar chart for Flutter
Customizable bar chart for Flutter.
The component calculates min and max of data and resizes bars as needed.
Add a data collection with the values to generate the bars.
Add a string collection with the labels to display below the items (optional)
Change bar size, margins and top corners as needed.
Change bar's color based on value. Callback, optional.
Enable/disable value on top of bar
Add an icon to the top of the bar based on item's value. Callback, optiona.
Enable/disable animation.
Change animation duration and curve through the properties
Animated calendar grid for Flutter
Generates a grid for the selected month.
Changes day color through callback.
Animates changes. Animation curve and duration can be modified with the properties.
Demo
Usage
To use plugin, just import package import 'package:chart_components/chart_components.dart';
Example
Check de example directory to access the project that implements the image shown above.