
 v1.1.0
awesome_circular_chart
Flutter용 애니메이션 레디얼 및 파이 차트
38좋아요 9.6천30일 다운로드140Pub 점수
AndroidiOSWebmacOSWindowsLinux
Flutter용 애니메이션 레디얼 및 파이 차트

{"sdk":"flutter"}{"sdk":"flutter"}아래는 영문 원문 스냅샷입니다. 최신 내용은 GitHub에서 확인하세요.
Fork from Flutter Circular Chart
A library for creating animated circular chart widgets with Flutter, inspired by Zero to One with Flutter.
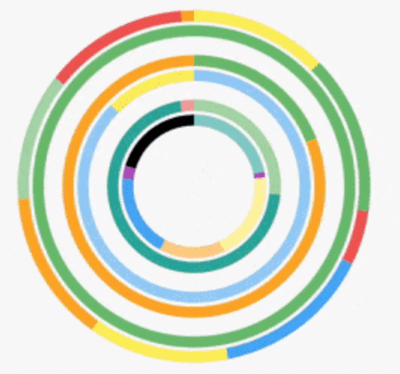
Create easily animated pie charts and radial charts by providing them with data objects they can plot into charts and animate between.
animated_random_radial_chart
animated pie chart animated radial chart
Check the examples folder for the source code for the above screenshots.
Install the latest version from pub.
Import the package:
import 'package:awesome_circular_chart/awesome_circular_chart.dart';
Create a GlobalKey to be able to access the chart and update its data:
final GlobalKey<AnimatedCircularChartState> _chartKey = new GlobalKey<AnimatedCircularChartState>();
Create chart data entry objects:
List<CircularStackEntry> data = <CircularStackEntry>[
  new CircularStackEntry(
    <CircularSegmentEntry>[
      new CircularSegmentEntry(500.0, Colors.red[200], rankKey: 'Q1'),
      new CircularSegmentEntry(1000.0, Colors.green[200], rankKey: 'Q2'),
      new CircularSegmentEntry(2000.0, Colors.blue[200], rankKey: 'Q3'),
      new CircularSegmentEntry(1000.0, Colors.yellow[200], rankKey: 'Q4'),
    ],
    rankKey: 'Quarterly Profits',
  ),
];
Create an AnimatedCircularChart, passing it the _chartKey and initial data:
@override
Widget build(BuildContext context) {
  return new AnimatedCircularChart(
    key: _chartKey,
    size: const Size(300.0, 300.0),
    initialChartData: data,
    chartType: CircularChartType.Pie,
  );
}
Call updateData to animate the chart:
void _cycleSamples() {
  List<CircularStackEntry> nextData = <CircularStackEntry>[
    new CircularStackEntry(
      <CircularSegmentEntry>[
        new CircularSegmentEntry(1500.0, Colors.red[200], rankKey: 'Q1'),
        new CircularSegmentEntry(750.0, Colors.green[200], rankKey: 'Q2'),
        new CircularSegmentEntry(2000.0, Colors.blue[200], rankKey: 'Q3'),
        new CircularSegmentEntry(1000.0, Colors.yellow[200], rankKey: 'Q4'),
      ],
      rankKey: 'Quarterly Profits',
    ),
  ];
  setState(() {
    _chartKey.currentState.updateData(nextData);
  });
}
| Property | Default |
|---|---|
| holeLabel | null |
| labelStyle | Theme.of(context).textTheme.body2 |
Example:
new AnimatedCircularChart(
  key: _chartKey,
  size: _chartSize,
  initialChartData: <CircularStackEntry>[
    new CircularStackEntry(
      <CircularSegmentEntry>[
        new CircularSegmentEntry(
          33.33,
          Colors.blue[400],
          rankKey: 'completed',
        ),
        new CircularSegmentEntry(
          66.67,
          Colors.blueGrey[600],
          rankKey: 'remaining',
        ),
      ],
      rankKey: 'progress',
    ),
  ],
  chartType: CircularChartType.Radial,
  percentageValues: true,
  holeLabel: '1/3',
  labelStyle: new TextStyle(
    color: Colors.blueGrey[600],
    fontWeight: FontWeight.bold,
    fontSize: 24.0,
  ),
)
hole label example screenshot
| Property | Default |
|---|---|
| edgeStyle | SegmentEdgeStyle.flat |
| SegmentEdgeStyle | Description |
|---|---|
| flat (default) | Segments begin and end with a flat edge. |
| round | Segments begin and end with a semi-circle. |
Example:
new AnimatedCircularChart(
  key: _chartKey,
  size: _chartSize,
  initialChartData: <CircularStackEntry>[
    new CircularStackEntry(
      <CircularSegmentEntry>[
        new CircularSegmentEntry(
          33.33,
          Colors.blue[400],
          rankKey: 'completed',
        ),
        new CircularSegmentEntry(
          66.67,
          Colors.blueGrey[600],
          rankKey: 'remaining',
        ),
      ],
      rankKey: 'progress',
    ),
  ],
  chartType: CircularChartType.Radial,
  edgeStyle: SegmentEdgeStyle.round,
  percentageValues: true,
)
round segment edge example screenshot
Charts expect a list of CircularStackEntry objects containing the data they need to be drawn.
Each CircularStackEntry corresponds to a complete circle in the chart. For radial charts that is one of the rings, for pie charts it is the whole pie.
Radial charts with multiple CircularStackEntrys will display them as concentric circles.
Each CircularStackEntry is composed of multiple CircularSegmentEntrys containing the value of a data point. In radial charts a segment corresponds to an arc segment of the current ring, for pie charts it is an individual slice.