
 v0.0.13
progress_bar_chart
一個用於在垂直圖表上使用進度指示器和動畫顯示多個值的套件。
14喜歡 113近 30 天下載145Pub 分數
AndroidiOSWebmacOSWindowsLinux
一個用於在垂直圖表上使用進度指示器和動畫顯示多個值的套件。

{"sdk":"flutter"}^0.20.2^4.5.0{"sdk":"flutter"}^4.0.0以下為英文專案原文快照,最新內容請造訪 GitHub。
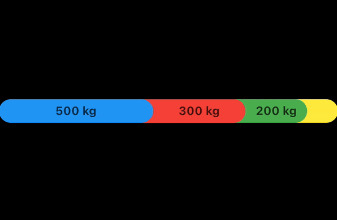
A package to display multipe values on a vertical chart using progess indicators and animation. Each value can has a color .
| Example 1 | Example 2 |
|---|---|
| Example | Example |
Example 1:
final List<StatisticsItem> stats = [
  StatisticsItem(Colors.blue, 500, title: 'Type 1'),
  StatisticsItem(Colors.green, 200, title: 'Type 2'),
  StatisticsItem(Colors.red, 300, title: 'Type 3'),
  StatisticsItem(Colors.yellow, 100, title: 'Type 4'),
];

ProgressBarChart(
    values: stats,
    height: 30,
    borderRadius: 20,
    totalPercentage: 1100,
    unitLabel: 'kg',
),
Example 2:
final List<StatisticsItem> stats = [
  StatisticsItem(Colors.blue, 0.4),
  StatisticsItem(Colors.green, 0.3),
  StatisticsItem(Colors.red, 0.2),
  StatisticsItem(Colors.yellow, 0.1),
];

ProgressBarChart(
  values: stats,
  height: 30,
  borderRadius: 20,
),
Without labels and colorblend:
final List<StatisticsItem> stats = [
  StatisticsItem(Colors.blue, 0.4),
  StatisticsItem(Colors.green, 0.3),
  StatisticsItem(Colors.red, 0.2),
  StatisticsItem(Colors.yellow, 0.1),
];

ProgressBarChart(
  values: stats,
  height: 30,
  borderRadius: 20,
  showLables: false,
  colorBlend: false,
)