
 v0.2.1
flutter_radar_chart
適用於 Flutter 的基本雷達圖。此圖表旨在開箱即用,能根據給定資料自動調整。圖表設計靈感來自 Python Graph Gallery。
101喜歡 1840近 30 天下載140Pub 分數
AndroidiOSWebmacOSWindowsLinux
Flutter 的基本雷達圖

{"sdk":"flutter"}{"sdk":"flutter"}以下為英文專案原文快照,最新內容請造訪 GitHub。
Animated radar chart for Flutter inspired by The Python Graph Gallery (https://python-graph-gallery.com/radar-chart/).
Follow the instructions on pub to install this package.
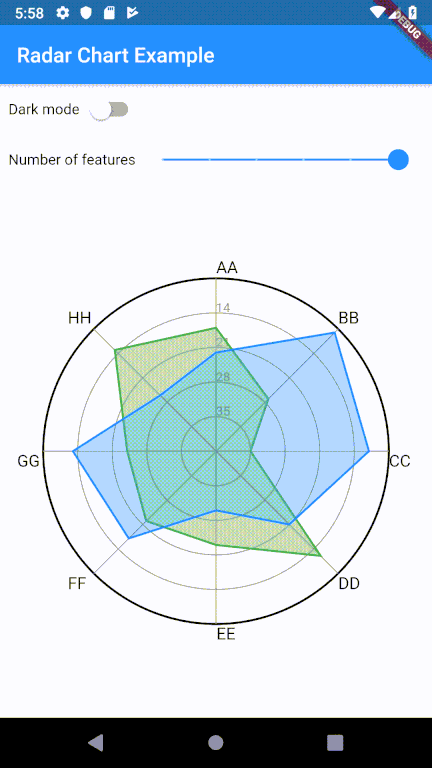
screenshot
Basic usage of radar chart requires three pieces of data:
ticks - Defines the numerical axis for the chart. Each tick generates an outline. Currently, each feature is plotted using the numerical range define by the ticks.features - Defines the numerical variables for each individual in the chart. There is no limit to the number of features.data - List of data points used to construct each individual in the chart. The number of data points must match the number of features. There is no limit to the number of individuals in the chart; however, multiple entities might cause the graph to become unreadable.RadarChart.light(
ticks: ticks,
features: features,
data: data,
),
A full example (as seen in the screenshots) can be found in example/lib/main.dart
Most of the customizability of the graph is a work in progress, but here's some of the features of the chart:
didUpdateWidget). Animations are currently enabled by default.screenshot
There's a few more areas of work that I'd love to get around to building. I will eventually move these items over to issues for better tracking.