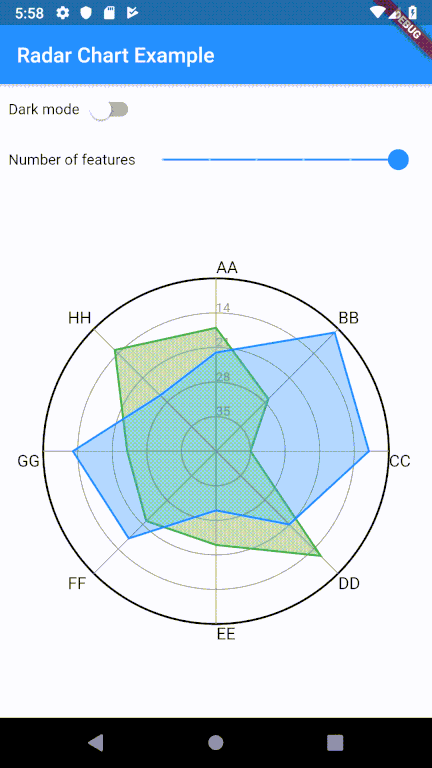
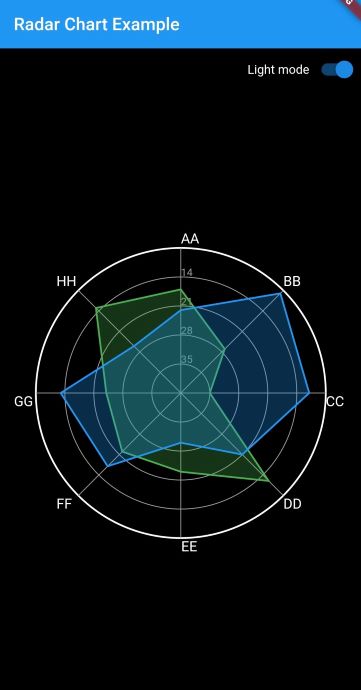
Animated radar chart for Flutter inspired by The Python Graph Gallery (https://python-graph-gallery.com/radar-chart/).
Follow the instructions on pub to install this package.
Example
Usage
Basic usage of radar chart requires three pieces of data:
ticks - Defines the numerical axis for the chart. Each tick generates an outline. Currently, each feature is plotted using the numerical range define by the ticks.
features - Defines the numerical variables for each individual in the chart. There is no limit to the number of features.
data - List of data points used to construct each individual in the chart. The number of data points must match the number of features. There is no limit to the number of individuals in the chart; however, multiple entities might cause the graph to become unreadable.
A full example (as seen in the screenshots) can be found in example/lib/main.dart
Customizability
Most of the customizability of the graph is a work in progress, but here's some of the features of the chart:
Animations! Trying to add some life to the chart. Animation is currently triggered whenever the widget is updated (didUpdateWidget). Animations are currently enabled by default.
Number of features: As shown in the example, the radar chart will adjust to the number of given variables. More work is needed to ensure the chart doesn't explode when given invalid data.
Reverse axis: Reverses the axis range so that the min value starts at the graph outline.
Dark mode: Simple factory that showcases the color customizability of the chart.
Polygon sides: Ability to use flat polygon borders instead of a circular border.
Future Work Ideas
There's a few more areas of work that I'd love to get around to building. I will eventually move these items over to issues for better tracking.