

 v1.0.1
chart_components
兩個用於 Flutter 的圖表組件。基於 GitHub 的動畫條形圖和動畫日曆網格圖。許多可自定義屬性。
49喜歡 79近 30 天下載70Pub 分數
平台暫無資料
適用於 Flutter 的動畫條形圖組件

以下為英文專案原文快照,最新內容請造訪 GitHub。
Customizable bar chart for Flutter. The component calculates min and max of data and resizes bars as needed.


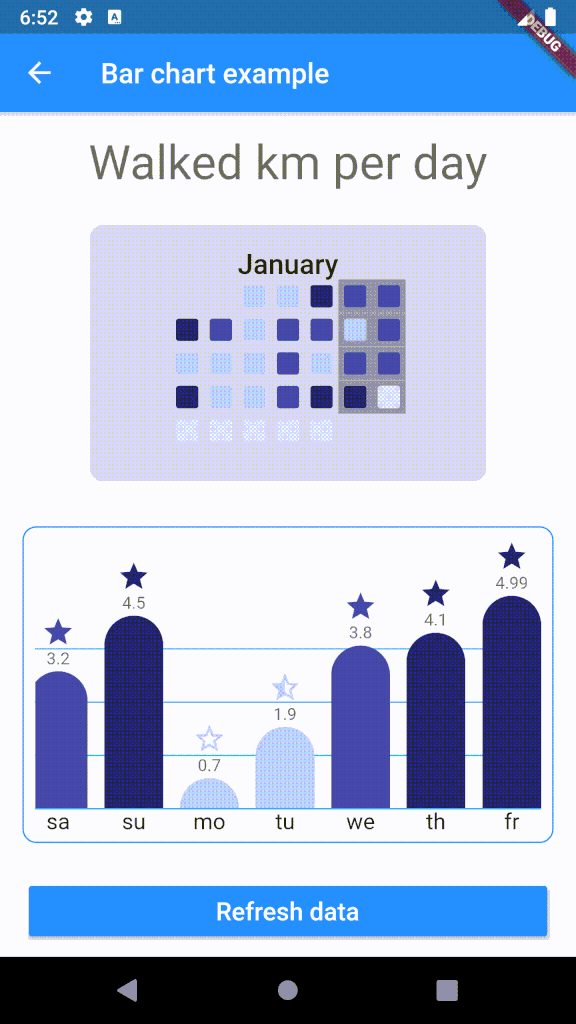
To use plugin, just import package import 'package:chart_components/chart_components.dart';
Check de example directory to access the project that implements the image shown above.
        ........
                    CalendarGrid(
                            year: 2020,
                            month: 1,
                            getColorOfDay: DataRepository.getDayColor,
                            animationDuration: Duration(milliseconds: 1500),
                    ),

        ...........
                    child: BarChart(
                    data: data,
                    labels: labels,
                    dislplayValue: true,
                    reverse: true,
                    getColor: DataRepository.getColor,
                    getIcon: DataRepository.getIcon,
                    barWidth: 42,
                    barSeparation: 12,
                    animationDuration: Duration(milliseconds: 1800),
                    animationCurve: Curves.easeInOutSine,
                    itemRadius: 30,
                    iconHeight: 24,
                    footerHeight: 24,
                    headerValueHeight: 16,
                    roundValuesOnText: false,
                    lineGridColor: Colors.lightBlue,
                    ),
依賴清單 2 項
{"sdk":"flutter"}{"sdk":"flutter"}先依使用情境篩選,再比較專案活躍情況,最後到原始儲存庫確認使用要求。
“A repository is the most basic element of GitHub.”
GitHub Docs — About repositories ↗