Chart_Components
Animated bar chart for Flutter
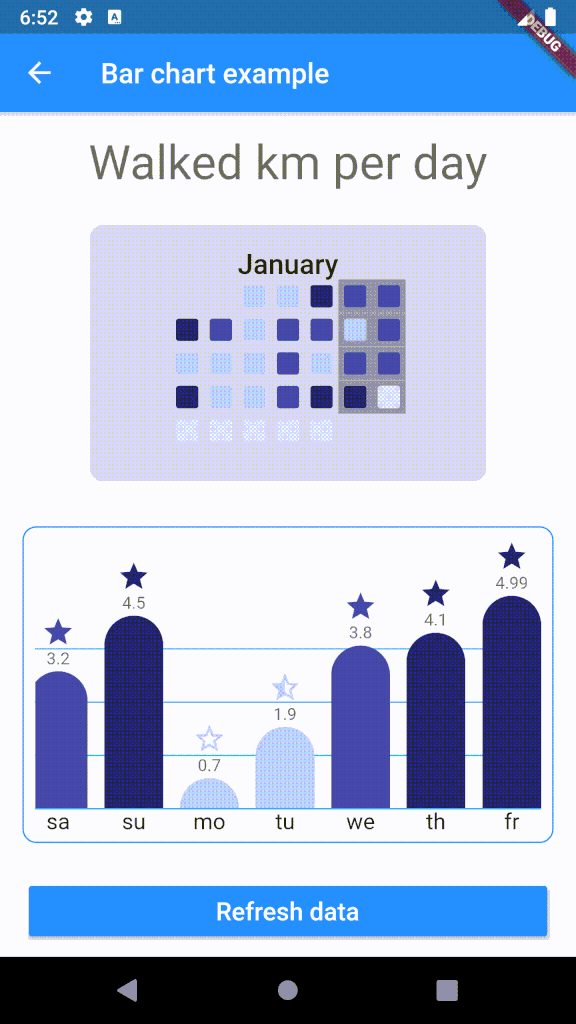
Customizable bar chart for Flutter.
The component calculates min and max of data and resizes bars as needed.

- Add a data collection with the values to generate the bars.
- Add a string collection with the labels to display below the items (optional)
- Change bar size, margins and top corners as needed.
- Change bar's color based on value. Callback, optional.
- Enable/disable value on top of bar
- Add an icon to the top of the bar based on item's value. Callback, optiona.
- Enable/disable animation.
- Change animation duration and curve through the properties
Animated calendar grid for Flutter
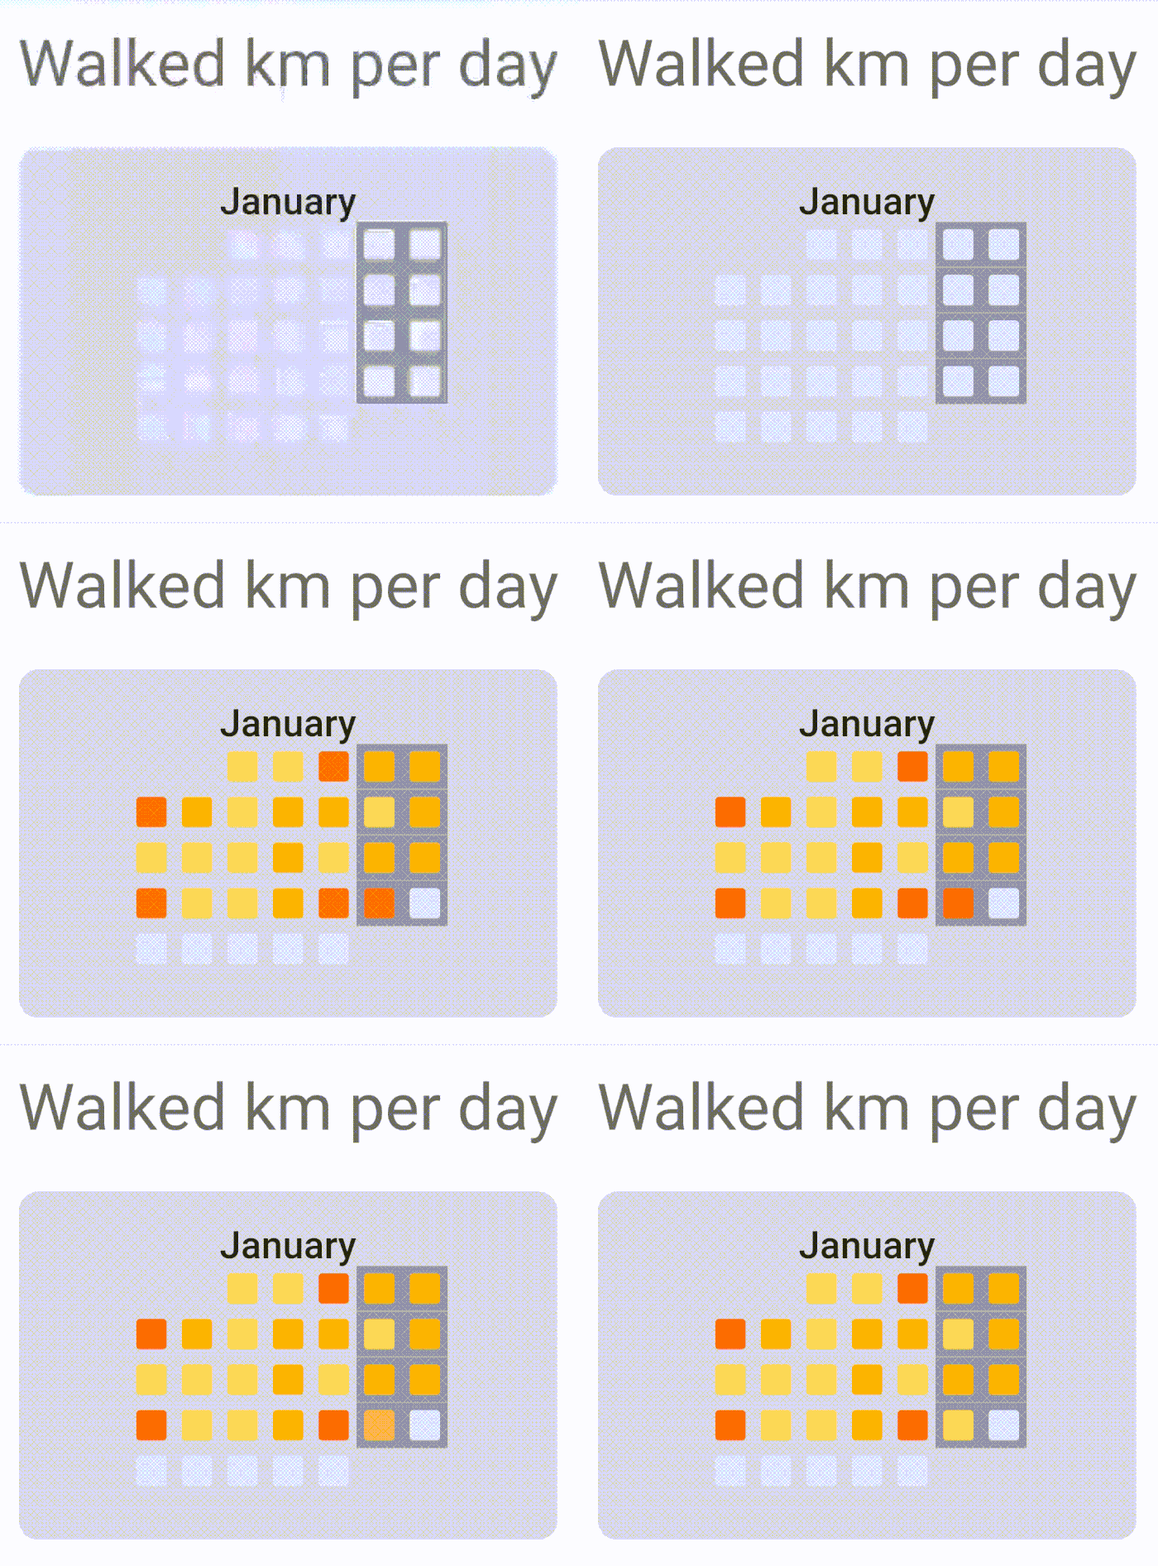
- Generates a grid for the selected month.
- Changes day color through callback.
- Animates changes. Animation curve and duration can be modified with the properties.
Demo

Usage
To use plugin, just import package import 'package:chart_components/chart_components.dart';
Example
Check de example directory to access the project that implements the image shown above.
        ........
                    CalendarGrid(
                            year: 2020,
                            month: 1,
                            getColorOfDay: DataRepository.getDayColor,
                            animationDuration: Duration(milliseconds: 1500),
                    ),

        ...........
                    child: BarChart(
                    data: data,
                    labels: labels,
                    dislplayValue: true,
                    reverse: true,
                    getColor: DataRepository.getColor,
                    getIcon: DataRepository.getIcon,
                    barWidth: 42,
                    barSeparation: 12,
                    animationDuration: Duration(milliseconds: 1800),
                    animationCurve: Curves.easeInOutSine,
                    itemRadius: 30,
                    iconHeight: 24,
                    footerHeight: 24,
                    headerValueHeight: 16,
                    roundValuesOnText: false,
                    lineGridColor: Colors.lightBlue,
                    ),