

 v1.2.0
fl_animated_linechart
動畫 Flutter 折線圖與面積圖。支援大資料集,支援多個 Y 軸和時間軸 X 軸。
73喜歡 175近 30 天下載130Pub 分數
AndroidiOSWebmacOSWindowsLinux
用於 Flutter 的動畫折線圖

以下為英文專案原文快照,最新內容請造訪 GitHub。


An animated chart library for flutter.
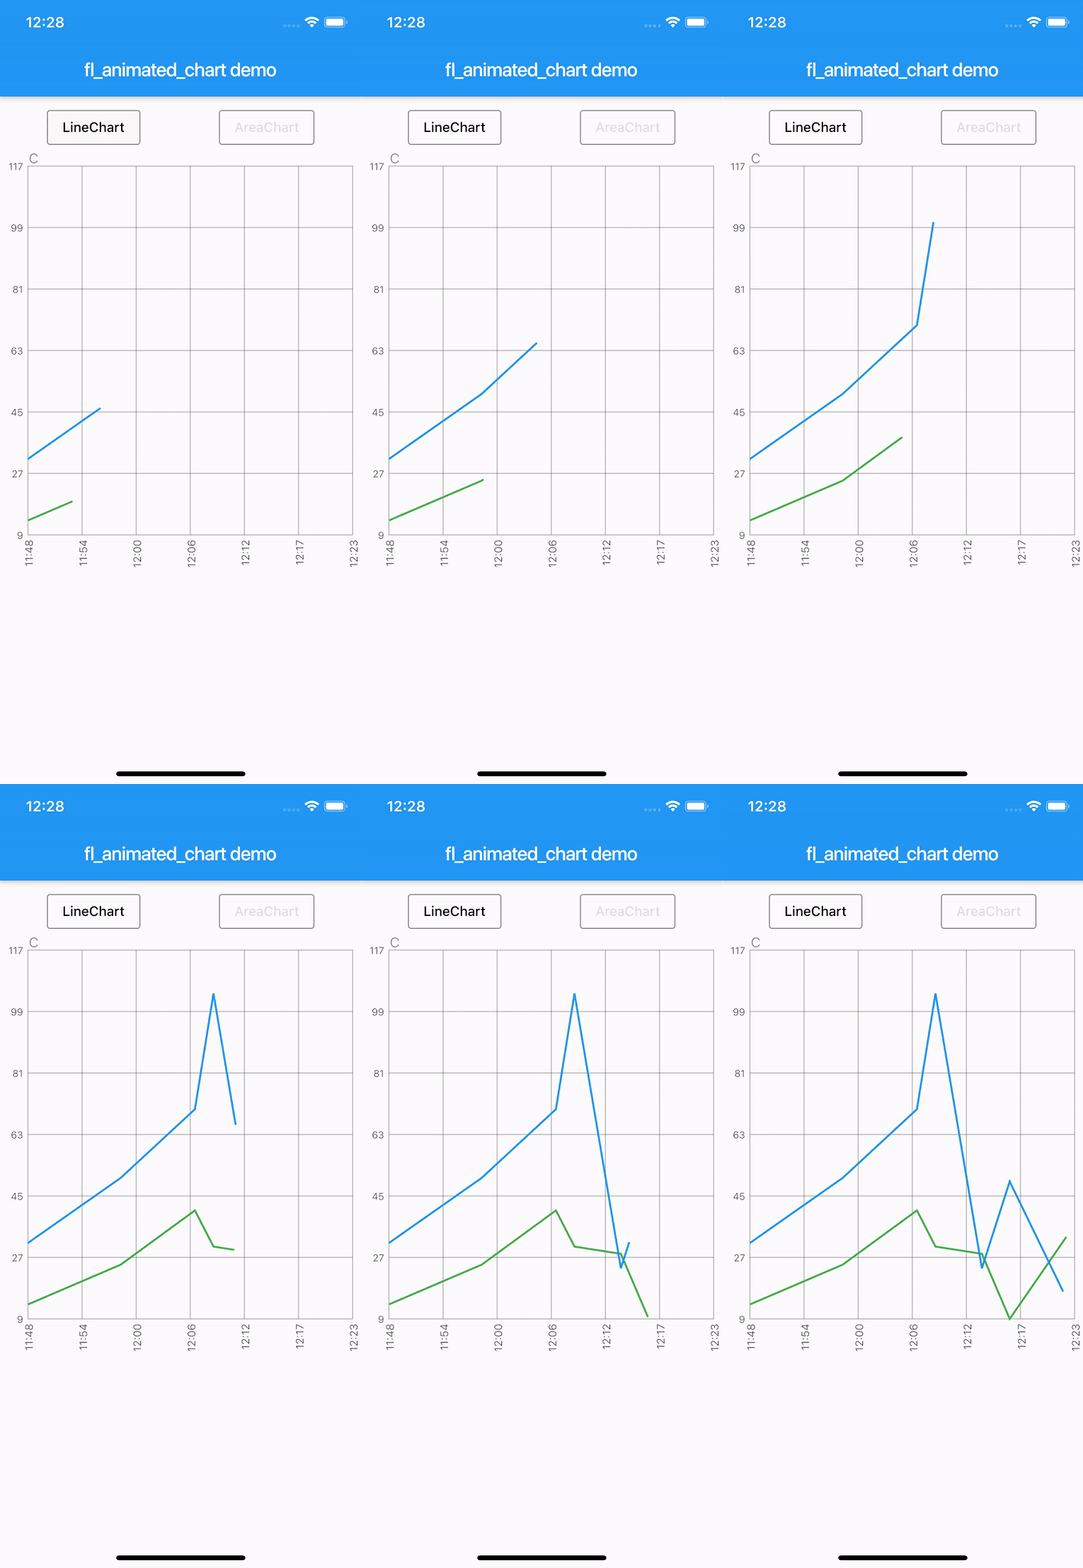
There are currently two different charts:
Try the sample project or include in your project.
Highlight for the line chart:

Linechart with markerlines, icons, legends and "heat-map" shaded zones:


Area chart:


Example code:
    LineChart lineChart = LineChart.fromDateTimeMaps([line1, line2], [Colors.green, Colors.blue]);

    return Scaffold(
      appBar: AppBar(
        title: Text(widget.title),
      ),
      body: Container(
        child: Column(
            mainAxisSize: MainAxisSize.max,
            mainAxisAlignment: MainAxisAlignment.spaceBetween,
            crossAxisAlignment: CrossAxisAlignment.stretch,
            children: [
              Expanded(child: AnimatedLineChart(lineChart)),
            ]
        ),
      ),
    );
LineChart lineChart = LineChart.fromDateTimeMaps([
    line1,
    line2,
    line3,
    line4,
    line5
  ], [
    Colors.blue,
    Colors.red,
    Colors.yellow,
    Colors.yellow,
    Colors.red
  ], [
    'C',
    'C',
    'C',
    'C',
    'C',
  ], tapTextFontWeight: FontWeight.w400);
To define a line as a horizontal dashed markerline, first define the line as any other regular line, then set isMarkerLine to true:
lineChart.lines[1].isMarkerLine = true;
lineChart.lines[2].isMarkerLine = true;
lineChart.lines[3].isMarkerLine = true;
lineChart.lines[4].isMarkerLine = true;
Or:
  lineChart.lines.skip(1).forEach((line) {
      line.isMarkerLine = true;
    });
Legends:
A Legend has the following constructor:
const Legend({this.title, this.color, this.icon, this.style, this.showLeadingLine = false,});
You can choose to either have a short line or an Icon as the first part of the legend before the title. It is possible set showLeadingLine to true, then a short line will be shown in the color you have defined.
You can change the Color of the line and Icon, and the TextStyle of the String title.
The length of the Legends list must to equal to the length of chartlines which have isMakerLine = true.
When orientation of the screen is in landscape mode, it is possible to have the legends drawn on the right hand side instead of below the graph.
Simply set legendsRightLandscapeMode: true
      return Scaffold(
      appBar: AppBar(
        title: Text(widget.title),
      ),
      body: Container(
        child: Column(
          mainAxisSize: MainAxisSize.max,
          mainAxisAlignment: MainAxisAlignment.spaceBetween,
          crossAxisAlignment: CrossAxisAlignment.stretch,
          children: [
            Expanded(
              child: AnimatedLineChart(
                lineChart,
                toolTipColor: Colors.white,
                gridColor: Colors.black54,
                textStyle: TextStyle(fontSize: 10, color: Colors.black54),
                showMarkerLines:
                    true, // If this value is not set to true, all defines lines will be filled lines and not dashed
                legends: [
                  Legend(title: 'Critical', color: Colors.red, showLeadingLine: true),
                  Legend(title: 'Warning', color: Colors.yellow, Icon(Icons.report_problem_rounded, size: 17, color: Colors.yellow)),
                ],
                legendsRightLandscapeMode: true,
              ),
            ),
          ],
        ),
      ),
    );
It is possible to define a maximum of two vertical markerlines.
The verticalMarker variable is a List<DateTime> and the length can be >= 2.
If two vertical markerlines are defined, the area between the two lines will be filled with a color that can be defined with verticalMarkerColor.
It is possible to add an Icon on the point where the vertical markerline crosses the y-axis value by defining the verticalMarkerIcon.
The verticalMarkerIcon variable takes a List<Icon> and the lenght must be equal to the length of the verticalMarker variable.
The possibility of adding a colored background to the icons have been added and can be defined with iconBackgroundColor which takes a Color.
      return Scaffold(
      appBar: AppBar(
        title: Text(widget.title),
      ),
      body: Container(
        child: Column(
          mainAxisSize: MainAxisSize.max,
          mainAxisAlignment: MainAxisAlignment.spaceBetween,
          crossAxisAlignment: CrossAxisAlignment.stretch,
          children: [
            Expanded(
              child: AnimatedLineChart(
                lineChart,
                toolTipColor: Colors.white,
                gridColor: Colors.black54,
                textStyle: TextStyle(fontSize: 10, color: Colors.black54),
                showMarkerLines:
                    true, // If this value is not set to true, all defines lines will be filled lines and not dashed
                legends: [
                  Legend(title: 'Critical', color: Colors.red),
                  Legend(title: 'Warning', color: Colors.yellow),
                ],
                verticalMarker:[
                    DateTime.parse('2012-02-27 12:54:00'),
                    DateTime.parse('2012-02-27 13:16:00')
                        ],
                  verticalMarkerColor: Colors.yellow,
                  verticalMarkerIcon: [
                    Icon(
                      Icons.report_problem_rounded,
                      color: Colors.yellow,
                    ),
                    Icon(
                      Icons.check_circle_rounded,
                      color: Colors.green,
                    ),
                  ],
                  iconBackgroundColor: Colors.white,
              ),
            ),
          ],
        ),
      ),
    );
Example code with shaded area between markerlines:
It is possible to have shaded areas between the defined markerlines.
The shaded area will be in the same color as the markerline.
It is important that the order of enums in the List<MaxMin> filledMarkerLinesValues matches the order of defined markerlines to be shown in the graph.
Enums with the value MaxMin.MAX will draw to the top if there is only one markerline defined as MAX, otherwise it will draw from i - 1 where enum values are MAX.
If enum value is MaxMin.MIN the shaded area will draw downwards to i + 1, unless the index is the last in the list, then the shaded area will draw all the way to the bottom of the graph.
      return Scaffold(
      appBar: AppBar(
        title: Text(widget.title),
      ),
      body: Container(
        child: Column(
          mainAxisSize: MainAxisSize.max,
          mainAxisAlignment: MainAxisAlignment.spaceBetween,
          crossAxisAlignment: CrossAxisAlignment.stretch,
          children: [
            Expanded(
              child: AnimatedLineChart(
                  chart,
                  key: UniqueKey(),
                  gridColor: Colors.black54,
                  textStyle: TextStyle(fontSize: 10, color: Colors.black54),
                  toolTipColor: Colors.white,
                  showMarkerLines: true,
                  fillMarkerLines: true,
                  filledMarkerLinesValues:[
                          MaxMin.MAX,
                          MaxMin.MAX,
                          MaxMin.MIN,
                          MaxMin.MIN,
                        ],
              ),
            ),
          ],
        ),
      ),
    );
The example app, can toggle between line chart and area chart.

依賴清單 4 項
{"sdk":"flutter"}^0.19.0^1.0.1{"sdk":"flutter"}先依使用情境篩選,再比較專案活躍情況,最後到原始儲存庫確認使用要求。
“A repository is the most basic element of GitHub.”
GitHub Docs — About repositories ↗