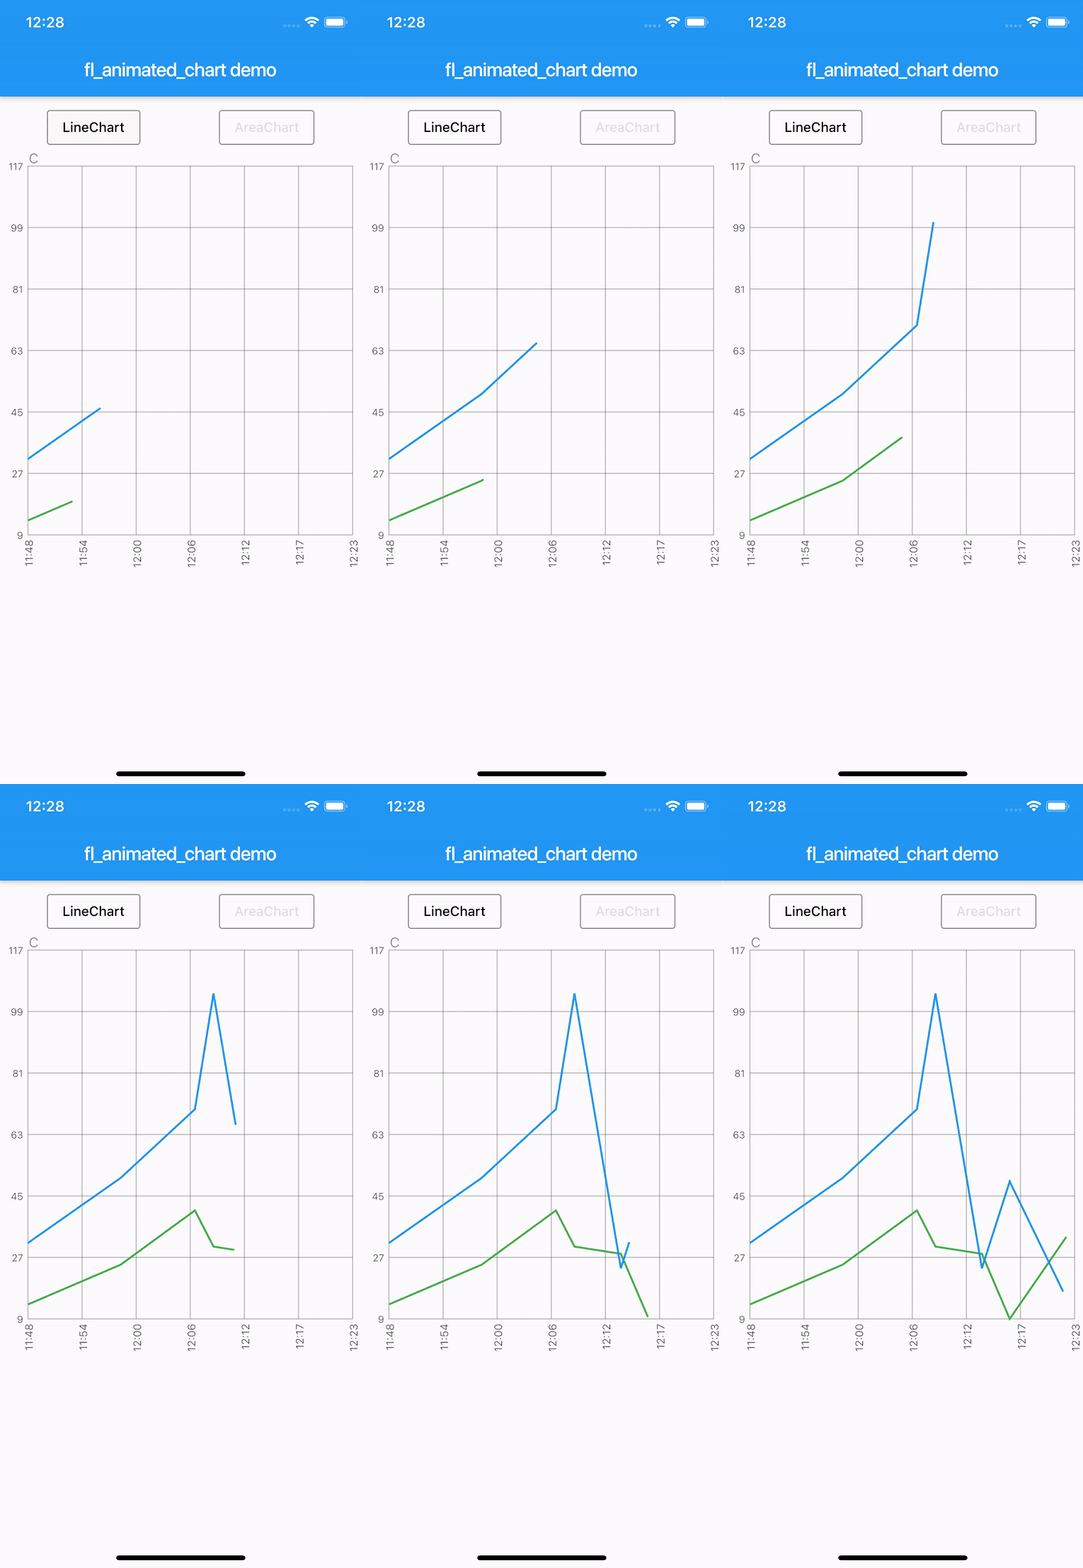
fl_animated_linechart 是一個用於建立動畫折線圖與面積圖的 Flutter 套件,即使在大型資料集上也能實現順暢效能。它支援多個 Y 軸以比較不同的資料尺度,並具備基於時間的 X 軸,非常適合時間序列視覺化。此套件針對跨平台響應性進行優化,適用於即時或動態資料顯示。建構於 Flutter 的渲染引擎之上,確保流暢的動畫與高效更新,同時不犧牲視覺品質。
適用情境
即時數據監控
時間序列分析
多指標儀表板
財務圖表
互動式數據探索
主要特色
動畫過渡
多 Y 軸支援
時間軸 X 軸
高效能處理大資料
跨平台相容性
適合對象
數據可視化應用
儀表板開發者
分析工具
行動和網路分析
即時追蹤介面
使用建議
需要仔細處理大型資料集以維持幀率
除了核心圖表類型外,自訂功能有限
複雜的 UI 可能需要額外的樣式
最適合線性或時間為基礎的資料模式
依賴外部相依性以實現進階功能
原始 README
以下為關聯原始碼儲存庫的 README 原文快照,最新內容請造訪原始碼儲存庫。
fl_animated_linechart
An animated chart library for flutter.
Support for datetime axis
Multiple y axis, supporting different units
Highlight selection
Animation of the chart
Possibility of adding legends
Support for both horizontal and vertical markerlines
Tested with more than 3000 points and still performing
There are currently two different charts:
line chart
area chart
Getting Started
Try the sample project or include in your project.
Highlight for the line chart:
Linechart with markerlines, icons, legends and "heat-map" shaded zones:
You can choose to either have a short line or an Icon as the first part of the legend before the title. It is possible set showLeadingLine to true, then a short line will be shown in the color you have defined.
You can change the Color of the line and Icon, and the TextStyle of the String title.
The length of the Legends list must to equal to the length of chartlines which have isMakerLine = true.
When orientation of the screen is in landscape mode, it is possible to have the legends drawn on the right hand side instead of below the graph.
Simply set legendsRightLandscapeMode: true
returnScaffold(
appBar: AppBar(
title: Text(widget.title),
),
body: Container(
child: Column(
mainAxisSize: MainAxisSize.max,
mainAxisAlignment: MainAxisAlignment.spaceBetween,
crossAxisAlignment: CrossAxisAlignment.stretch,
children: [
Expanded(
child: AnimatedLineChart(
lineChart,
toolTipColor: Colors.white,
gridColor: Colors.black54,
textStyle: TextStyle(fontSize: 10, color: Colors.black54),
showMarkerLines:
true, // If this value is not set to true, all defines lines will be filled lines and not dashed
legends: [
Legend(title: 'Critical', color: Colors.red, showLeadingLine: true),
Legend(title: 'Warning', color: Colors.yellow, Icon(Icons.report_problem_rounded, size: 17, color: Colors.yellow)),
],
legendsRightLandscapeMode: true,
),
),
],
),
),
);
Example code with horizontal and vertical markerlines along with icons on the chart and legends:
It is possible to define a maximum of two vertical markerlines.
The verticalMarker variable is a List<DateTime> and the length can be >= 2.
If two vertical markerlines are defined, the area between the two lines will be filled with a color that can be defined with verticalMarkerColor.
It is possible to add an Icon on the point where the vertical markerline crosses the y-axis value by defining the verticalMarkerIcon.
The verticalMarkerIcon variable takes a List<Icon> and the lenght must be equal to the length of the verticalMarker variable.
The possibility of adding a colored background to the icons have been added and can be defined with iconBackgroundColor which takes a Color.
returnScaffold(
appBar: AppBar(
title: Text(widget.title),
),
body: Container(
child: Column(
mainAxisSize: MainAxisSize.max,
mainAxisAlignment: MainAxisAlignment.spaceBetween,
crossAxisAlignment: CrossAxisAlignment.stretch,
children: [
Expanded(
child: AnimatedLineChart(
lineChart,
toolTipColor: Colors.white,
gridColor: Colors.black54,
textStyle: TextStyle(fontSize: 10, color: Colors.black54),
showMarkerLines:
true, // If this value is not set to true, all defines lines will be filled lines and not dashed
legends: [
Legend(title: 'Critical', color: Colors.red),
Legend(title: 'Warning', color: Colors.yellow),
],
verticalMarker:[
DateTime.parse('2012-02-27 12:54:00'),
DateTime.parse('2012-02-27 13:16:00')
],
verticalMarkerColor: Colors.yellow,
verticalMarkerIcon: [
Icon(
Icons.report_problem_rounded,
color: Colors.yellow,
),
Icon(
Icons.check_circle_rounded,
color: Colors.green,
),
],
iconBackgroundColor: Colors.white,
),
),
],
),
),
);
Example code with shaded area between markerlines:
It is possible to have shaded areas between the defined markerlines.
The shaded area will be in the same color as the markerline.
It is important that the order of enums in the List<MaxMin> filledMarkerLinesValues matches the order of defined markerlines to be shown in the graph.
Enums with the value MaxMin.MAX will draw to the top if there is only one markerline defined as MAX, otherwise it will draw from i - 1 where enum values are MAX.
If enum value is MaxMin.MIN the shaded area will draw downwards to i + 1, unless the index is the last in the list, then the shaded area will draw all the way to the bottom of the graph.