

 v1.2.1
graphify
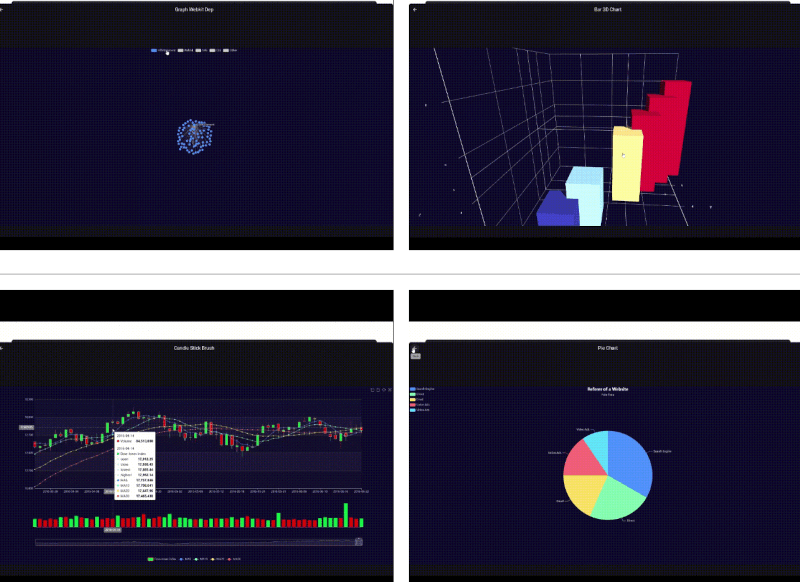
一個基於 Apache Echarts 的資料視覺化圖表庫,能夠建立進階圖表,如 WebGL 3D、柱狀圖、折線圖、K線圖、雷達圖、關係圖、樹狀圖等。
45喜歡 695近 30 天下載135Pub 分數
AndroidiOSWebmacOSWindows
一個基於 Apache Echarts 的資料視覺化圖表庫,能夠建立進階圖表,如 WebGL 3D、柱狀圖、折線圖、K線圖、雷達圖、關係圖、樹狀圖等。

以下為英文專案原文快照,最新內容請造訪 GitHub。





A data visualization charts library, based on Apache Echarts, able to build advanced charts like WebGL 3D, Bar, Line, Candlestick, Radar, Graph, Tree etc.
A Flutter package that serves as a bridge to Apache ECharts for creating interactive charts and data visualizations in your Flutter applications.
Features
Installation
Quick Start
Basic Example
Parameters and Settings
License
Contributing
How quickly you can install the package you can find here.
Import the package into your Dart file:
import 'package:graphify/graphify.dart';
Below is a minimal example demonstrating how to display a bar chart:
class BasicBarChart extends StatefulWidget {
  const BasicBarChart({super.key});

  @override
  State<BasicBarChart> createState() => _BasicBarChartState();
}

class _BasicBarChartState extends State<BasicBarChart> {

  final controller = GraphifyController();

  @override
  Widget build(BuildContext context) {
    return GraphifyView(
      controller: controller,
      initialOptions: const {
        "xAxis": {
          "type": "category",
          "data": ["Mon", "Tue", "Wed", "Thu", "Fri", "Sat", "Sun"]
        },
        "yAxis": {
          "type": "value"
        },
        "series": [
          {
            "data": [120, 200, 150, 80, 70, 110, 130],
            "type": "bar"
          }
        ]
      },
    );
  }

  @override
  void dispose() {
    controller.dispose();
    super.dispose();
  }

}
A string containing the JSON configuration for the chart, based on the Apache ECharts documentation.
Refer to the Apache ECharts Documentation for detailed configuration options and features. For source code, issue tracking, and contributions, visit the GitHub repository.
This project is licensed under the MIT License.
We welcome your contributions!
For bug reports or feature requests, please open an issue.
Thank you!
依賴清單 5 項
{"sdk":"flutter"}^4.10.0^1.1.1{"sdk":"flutter"}^3.0.1先依使用情境篩選,再比較專案活躍情況,最後到原始儲存庫確認使用要求。
“A repository is the most basic element of GitHub.”
GitHub Docs — About repositories ↗