搜尋套件、儲存庫與 APP 分類

graphify 封面
套件詳情v1.2.1

graphify

一個基於 Apache Echarts 的資料視覺化圖表庫,能夠建立進階圖表,如 WebGL 3D、柱狀圖、折線圖、K線圖、雷達圖、關係圖、樹狀圖等。

AndroidiOSWebmacOSWindows
近 30 天下載
695
喜歡數
45
Pub 分數
135

安裝套件

flutter pub add graphify

套件介紹

根據套件公開資料產生的選型評估,僅供參考。

Graphify 是一個基於 Apache Echarts 的 Flutter/Dart 套件,用於建立進階的資料視覺化。它支援多種圖表類型,包括 WebGL 3D、長條圖、折線圖、蠟燭圖、雷達圖、圖形圖和樹狀圖。專為跨平台使用設計,可在 Android、iOS、Web、macOS 和 Windows 上順暢運行。此套件讓開發者能以最少設定建構互動性高且效能優異的視覺化效果。適用於儀表板、分析應用程式與資料驅動介面,Graphify 將強大的圖表功能直接帶入 Flutter 應用程式。

適用情境

  • 互動式儀表板
  • 即時資料監控
  • 財務圖表
  • 資料分析平台
  • 科學可視化

主要特色

  • 支援 WebGL 3D 圖表
  • 多種圖表類型(長條圖、折線圖、K線圖等)
  • 跨平台相容性
  • 高效能渲染
  • 與 Flutter 的輕鬆整合
  • 可自訂的視覺主題

適合對象

  • 數據分析師
  • 儀表板開發者
  • 金融應用開發者
  • 教育軟體
  • 以可視化為重點的應用程式

使用建議

  • 需要理解 Echarts 概念
  • 由於 WebGL,套件大小可能更大
  • 原生 Flutter 小部件自訂功能有限
  • 最適合複雜的視覺化,不適合簡單的圖表
  • 依賴外部 Echarts 庫

原始 README

以下為關聯原始碼儲存庫的 README 原文快照,最新內容請造訪原始碼儲存庫。

graphify_banner

Pub Package GitHub Repo stars GitHub closed issues GitHub open issues GitHub contributors Contributing

GRAPHIFY

A data visualization charts library, based on Apache Echarts, able to build advanced charts like WebGL 3D, Bar, Line, Candlestick, Radar, Graph, Tree etc.

A Flutter package that serves as a bridge to Apache ECharts for creating interactive charts and data visualizations in your Flutter applications.

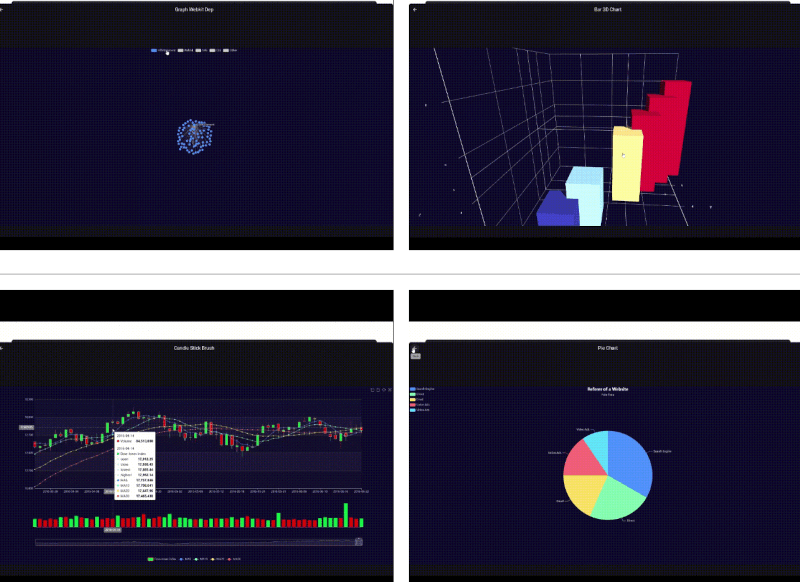
graph_webkit_dep bar_3d_chart
candle_stick_brush all

See demo
Echarts Examples
Pub.dev

Content

Features
Installation
Quick Start
Basic Example
Parameters and Settings
License
Contributing

Features

  • Apache ECharts Integration: Leverage the full power of Apache ECharts directly within your Flutter app.
  • Flexible Configuration: Pass chart configurations as JSON to render interactive visualizations.
  • All ECharts Features: You can find here eCharts features

Installation

How quickly you can install the package you can find here.

Quick Start

Importing the Package

Import the package into your Dart file:

import 'package:graphify/graphify.dart';
Basic Example

Below is a minimal example demonstrating how to display a bar chart:

class BasicBarChart extends StatefulWidget {
  const BasicBarChart({super.key});

  @override
  State<BasicBarChart> createState() => _BasicBarChartState();
}

class _BasicBarChartState extends State<BasicBarChart> {

  final controller = GraphifyController();

  @override
  Widget build(BuildContext context) {
    return GraphifyView(
      controller: controller,
      initialOptions: const {
        "xAxis": {
          "type": "category",
          "data": ["Mon", "Tue", "Wed", "Thu", "Fri", "Sat", "Sun"]
        },
        "yAxis": {
          "type": "value"
        },
        "series": [
          {
            "data": [120, 200, 150, 80, 70, 110, 130],
            "type": "bar"
          }
        ]
      },
    );
  }

  @override
  void dispose() {
    controller.dispose();
    super.dispose();
  }

}

Parameters and Settings

A string containing the JSON configuration for the chart, based on the Apache ECharts documentation.

Documentation and Support

Refer to the Apache ECharts Documentation for detailed configuration options and features. For source code, issue tracking, and contributions, visit the GitHub repository.

License

This project is licensed under the MIT License.

Contributing

We welcome your contributions!

  1. Fork the repository and create a branch for your changes.
  2. Commit your changes with clear messages.
  3. Open a pull request describing your work.

For bug reports or feature requests, please open an issue.

Thank you!

所屬分類

依賴

依賴清單 2 項

原始碼儲存庫

使用此套件的專案

暫無相關資料。