v2.5.0
flutter_echarts
Apache ECharts をベースにしたデータ可視化チャートライブラリで、WebGL 3D、GISマップなどの高度なチャートを構築できます。
578いいね 549030日間ダウンロード130Pub ポイント
AndroidiOSmacOS
スマートフォンから直接Linux PCの統計情報を監視するアプリです。

以下は英語原文のスナップショットです。最新版は GitHub をご覧ください。
An app to monitor linux PC stats such as CPU, Battery, RAM etc. on your phone.

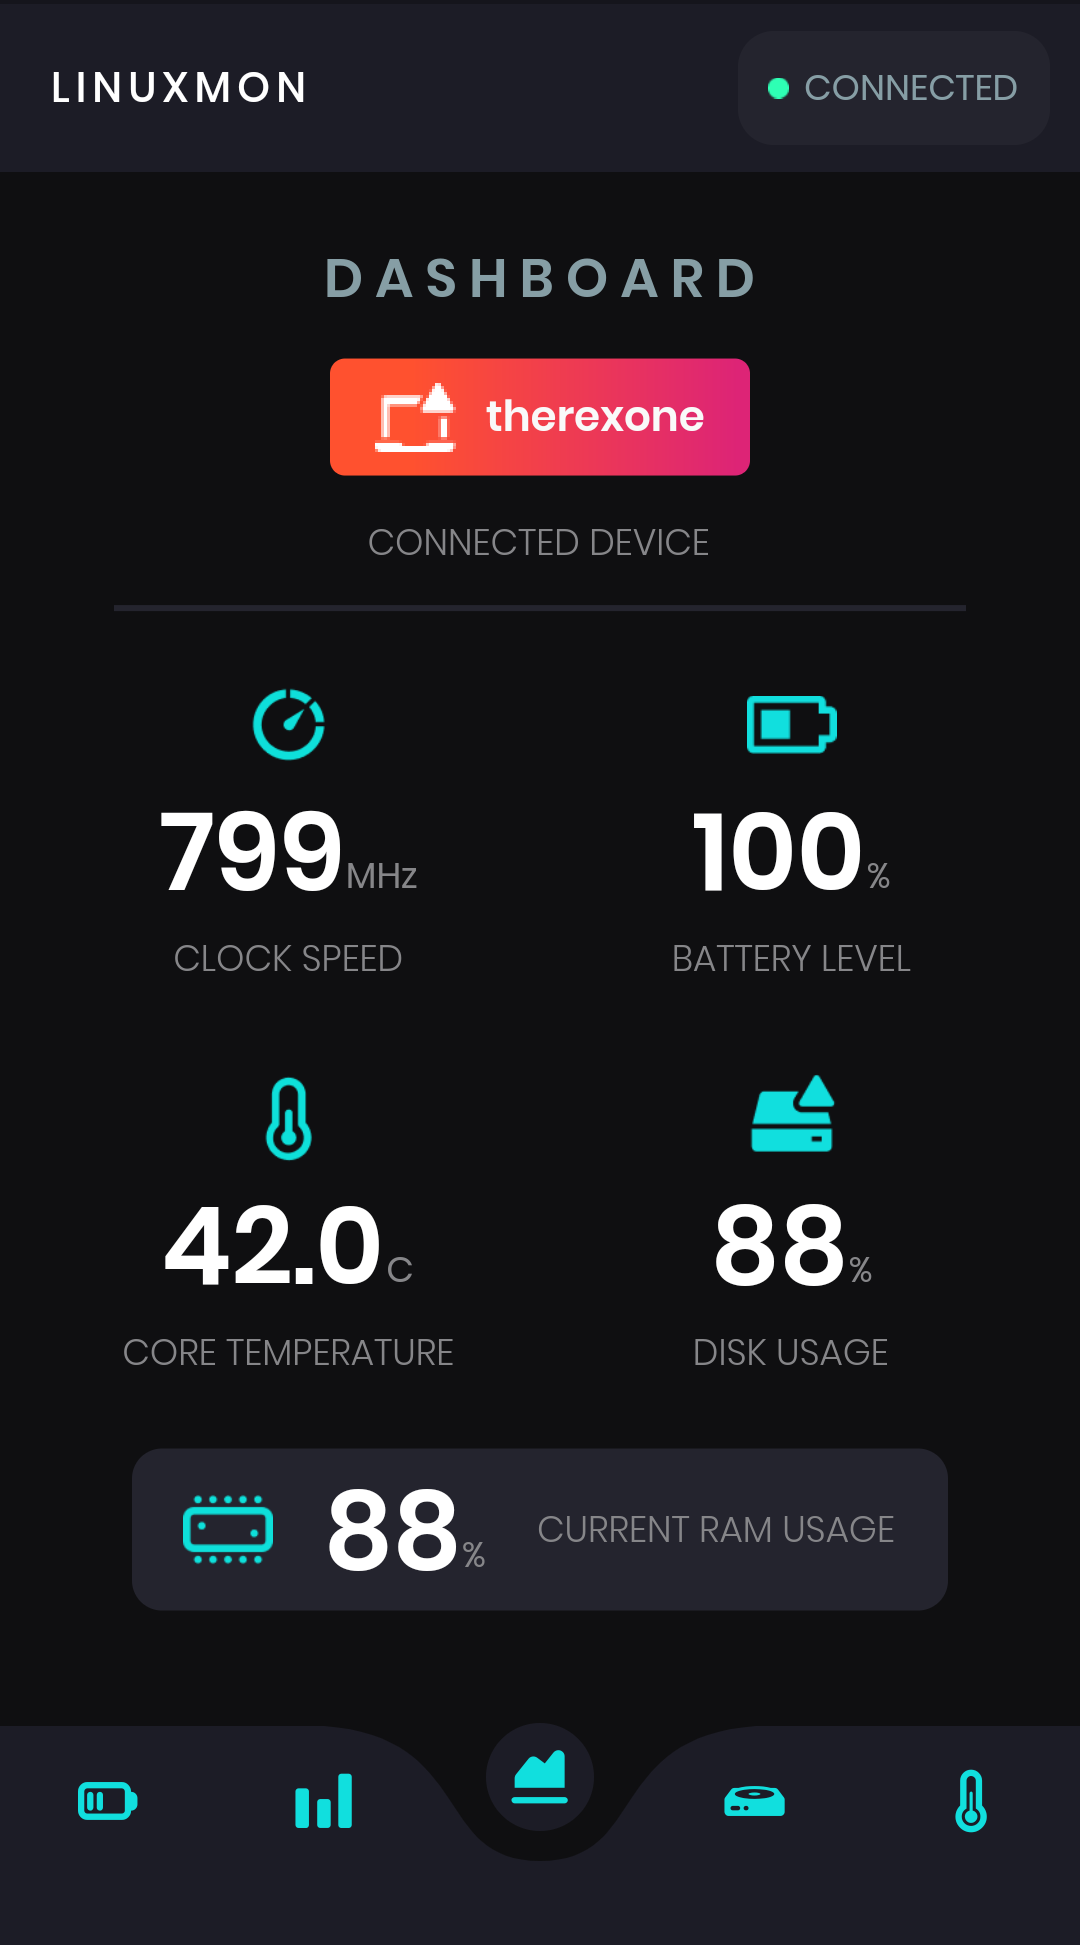
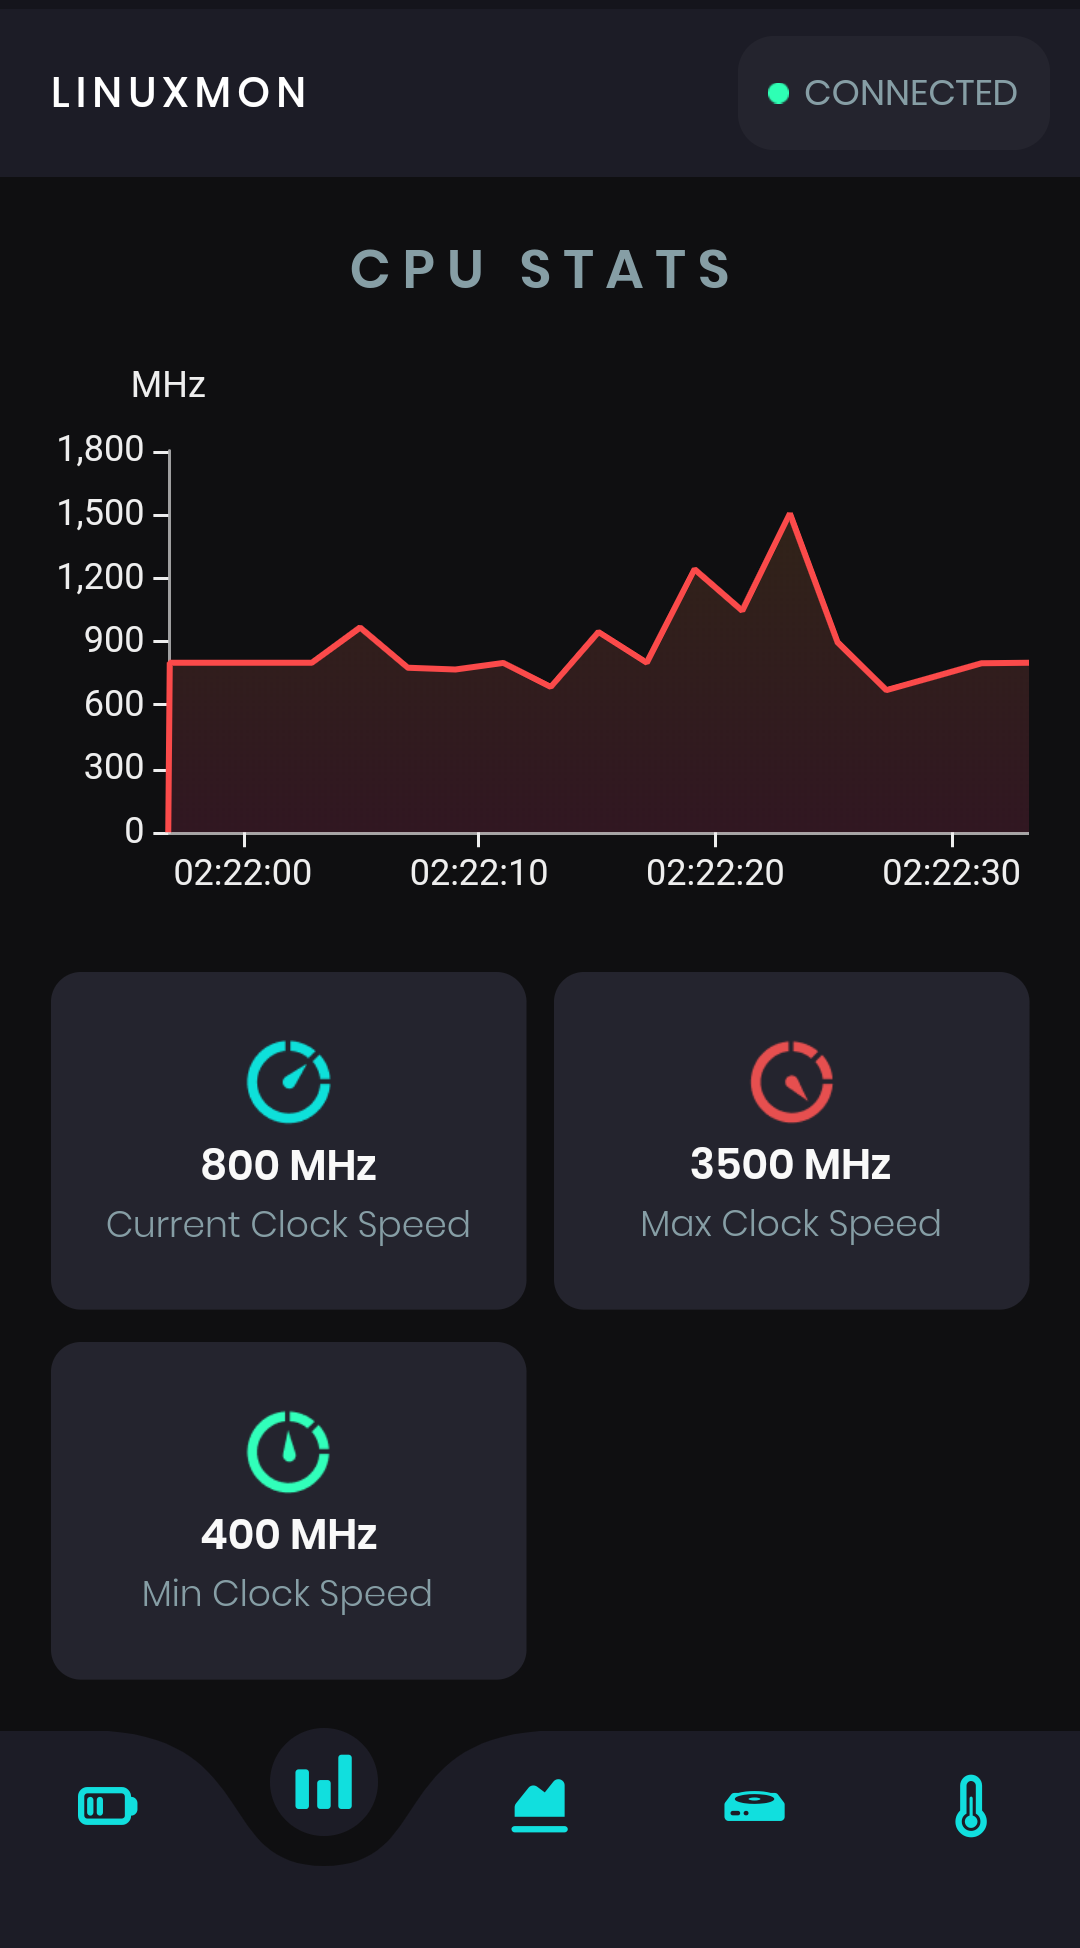
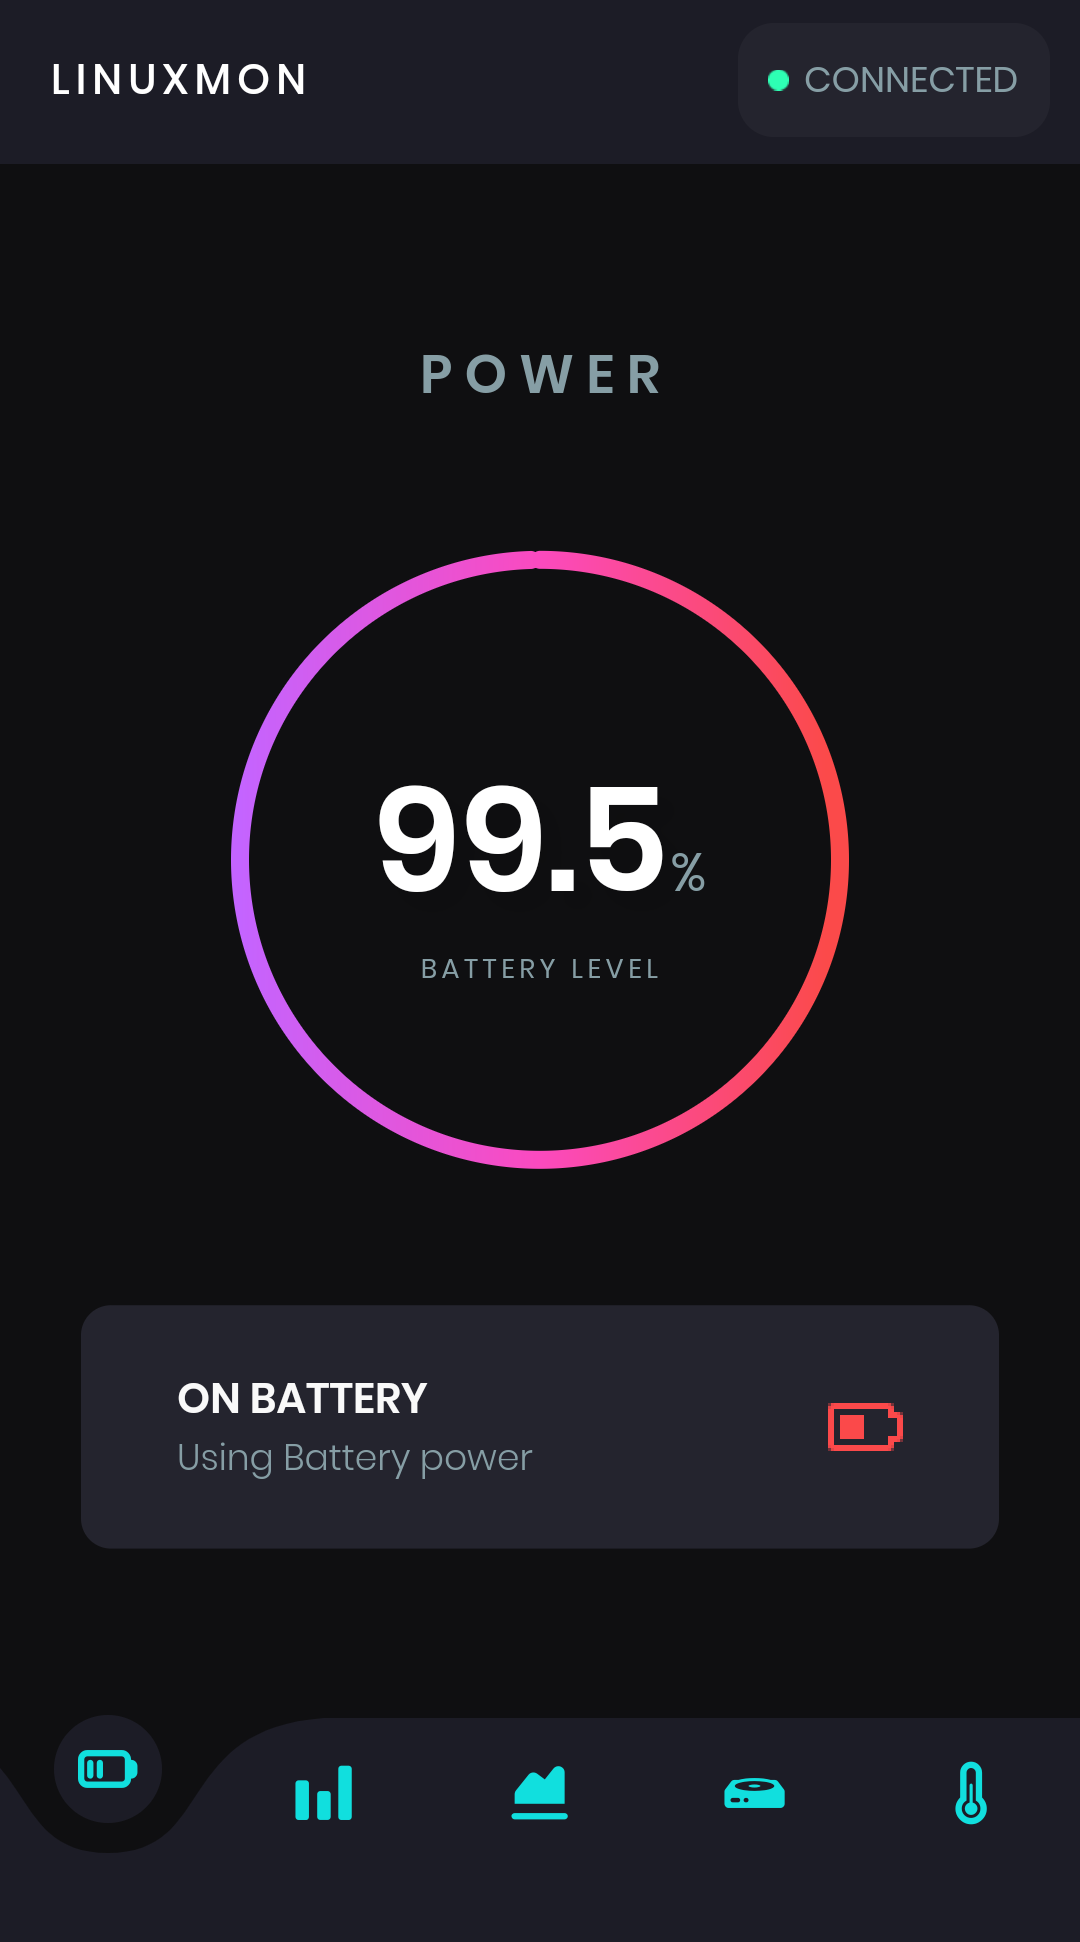
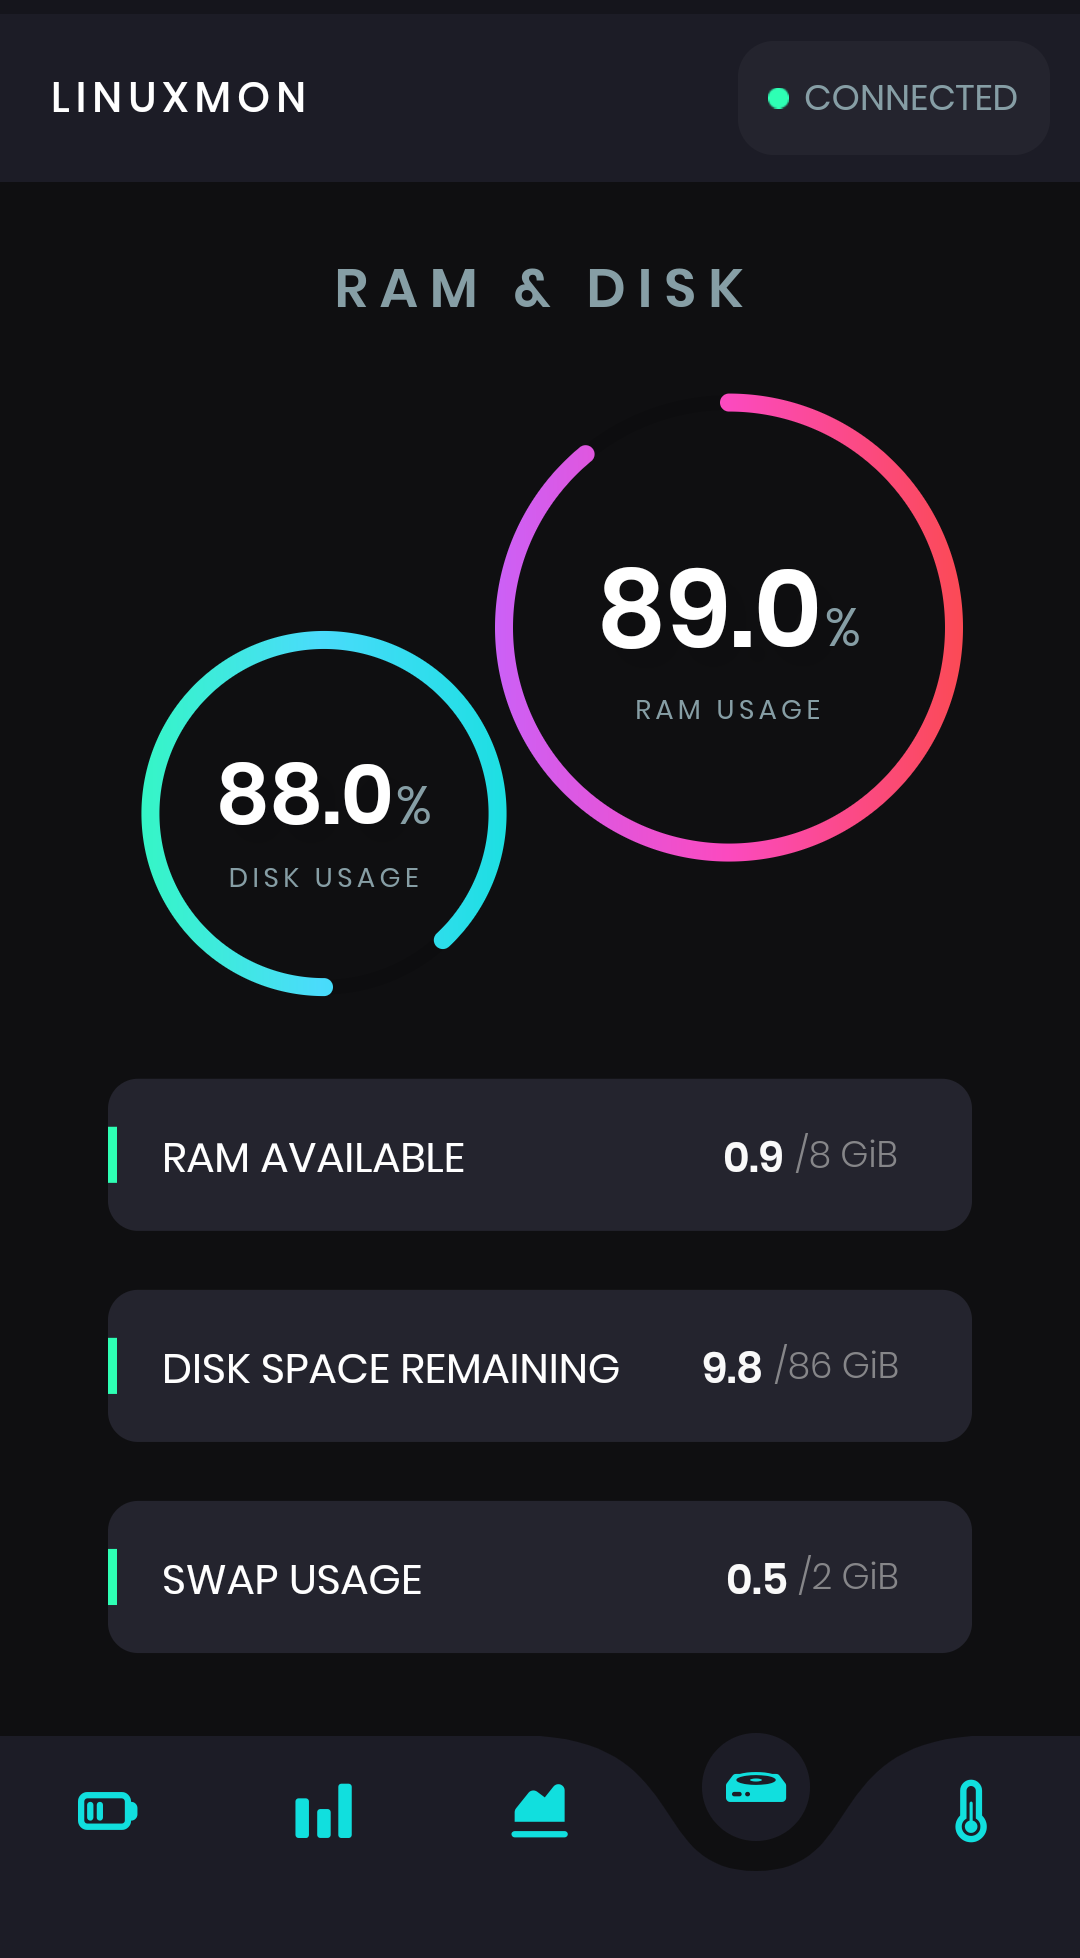
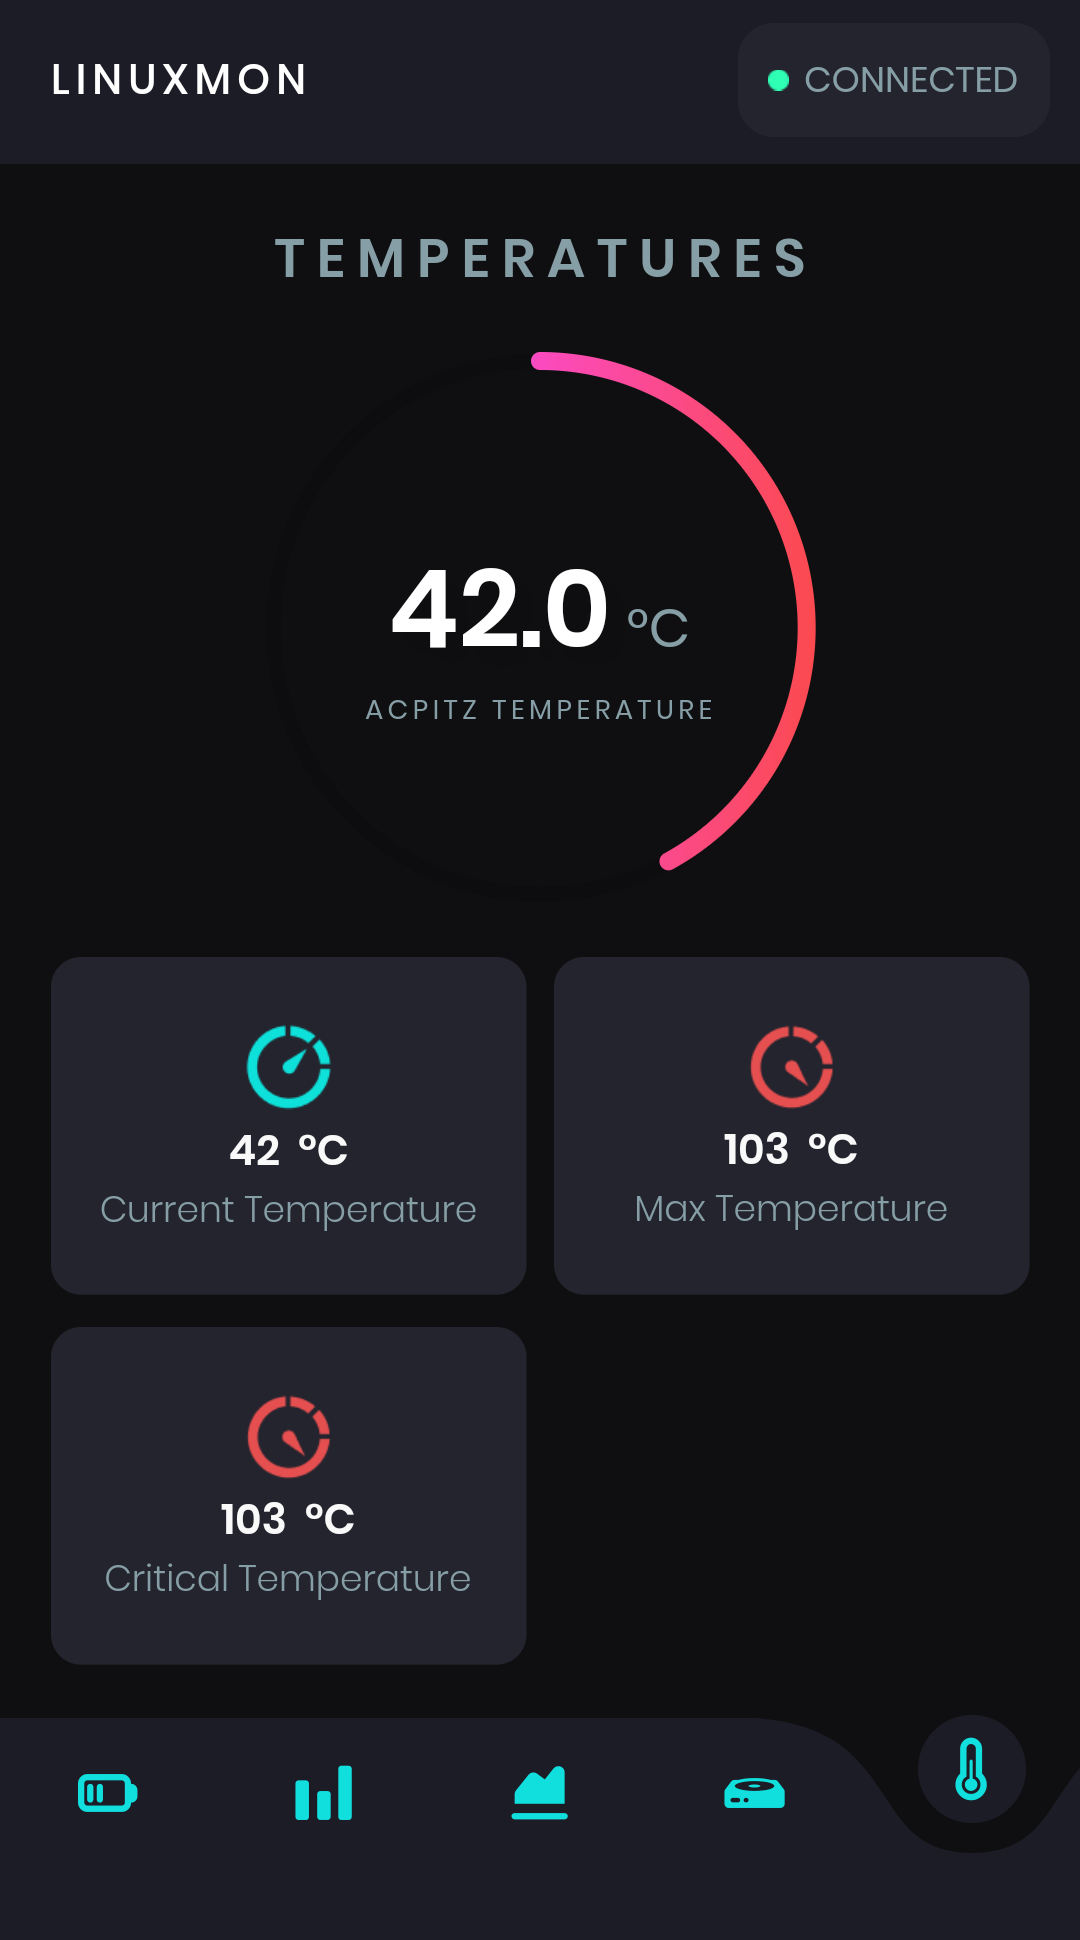
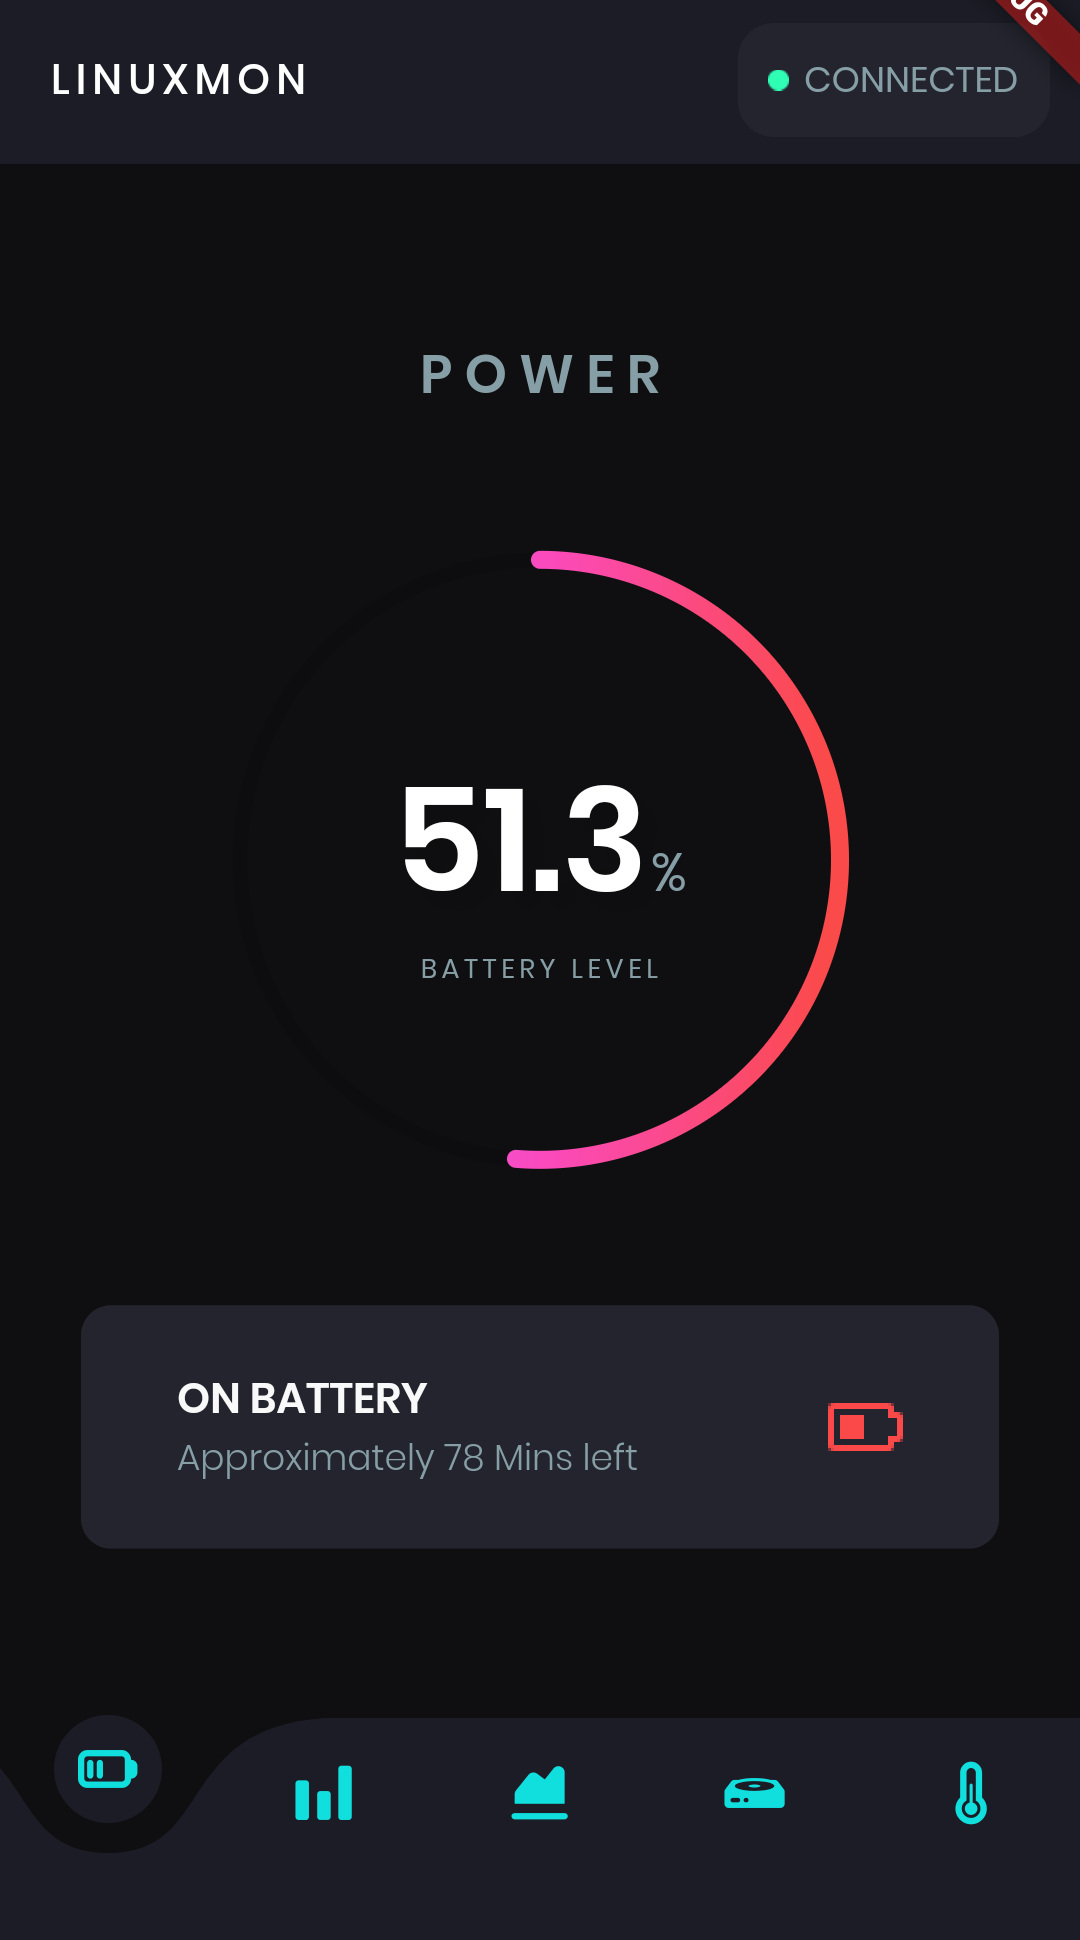

Install the server on your PC
./linux-dae-mon
- Temperature readings are not available on windows as the python library used (psutil) doesn't have this option
- CPU frequencies may not be accurate
Download linux-mon-windows.exe
Download exe
For other ways to run the server see scripts/README.md
The phone and the PC need to be on the same network to connect
The app will search for a server and connect automatically.
Apache ECharts をベースにしたデータ可視化チャートライブラリで、WebGL 3D、GISマップなどの高度なチャートを構築できます。
印象的なアニメーションカーブ形状ナビゲーションバー。色、背景色、アニメーションカーブ、アニメーション期間を調整可能。
IPサブネットをpingし、ネットワークデバイスを検出できるライブラリです。ローカルネットワーク内のプリンターやその他のデバイスおよびサービスを見つけるために使用できます。
依存関係一覧 10 件
{"sdk":"flutter"}^0.1.1^2.1.0^1.0.20.0.1^2.3.0^6.0.18{"sdk":"flutter"}^2.0.1+1^0.9.2用途で絞り込み、開発状況を比較し、採用前に元のリポジトリで要件を確認しましょう。
“A repository is the most basic element of GitHub.”
GitHub Docs — About repositories ↗